The intelligence dashboard displays post-interaction analytics and is a powerful tool designed to provide insights and actionable information following customer interactions. This dashboard gathers and presents data derived from customer interactions, allowing admins and supervisors to gain valuable insights into agent performance and customer interactions.
The key sections of this dashboard include:
- Contact Center Efficiency – Key Performance Indicators (Average Speed to Answer, Abandonment Rate, CSAT, and Transfer Rate).
- Agent Efficacy – Empathy Score, CSAT, Crutch Word Score, Agent Performance Monitor, and Agent Occupancy.
- Customer Experience – Avg. Wait Time, Net Promoter Score (NPS), and Churn Risk.
- Insights Mining – Topic vs. Sentiment Bubble, Keyword Cloud & Emotions
- Interaction Details – Date/Time of the session, Call ID, Agent name/ID, Description, Call Reason/Intent, Sentiment Score, and Dispositions.
Admins and Supervisors can access the Intelligence dashboard by going to DASHBOARD > Intelligence.

Filters
You can use the filters to customize the intelligence tab.
Create a Filter
Steps to create a filter:
- Click the Filters button on the upper right corner.

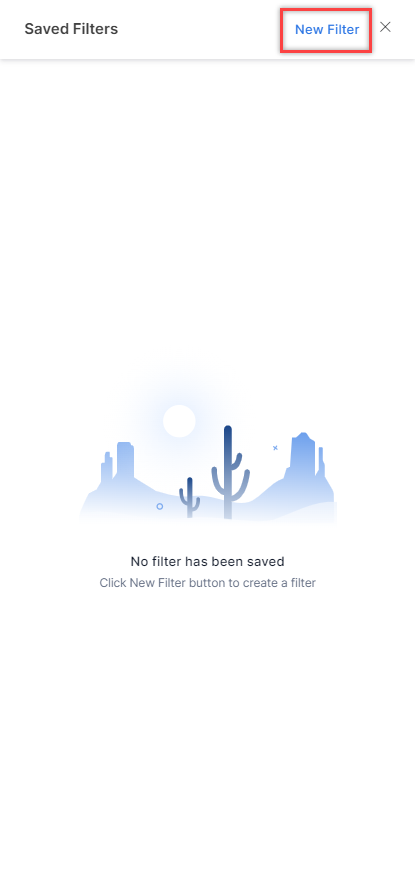
- Click the New Filter button.
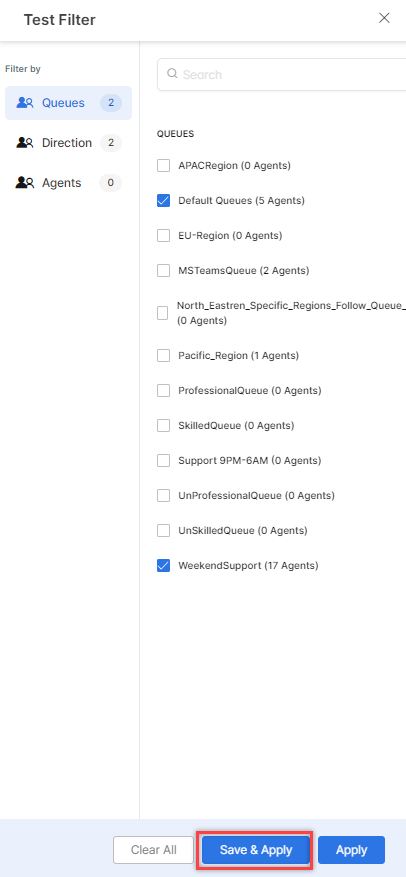
- On the New Filter window, you can choose from the following filters:
- Queues
- Direction (Inbound or Outbound)
- Agents
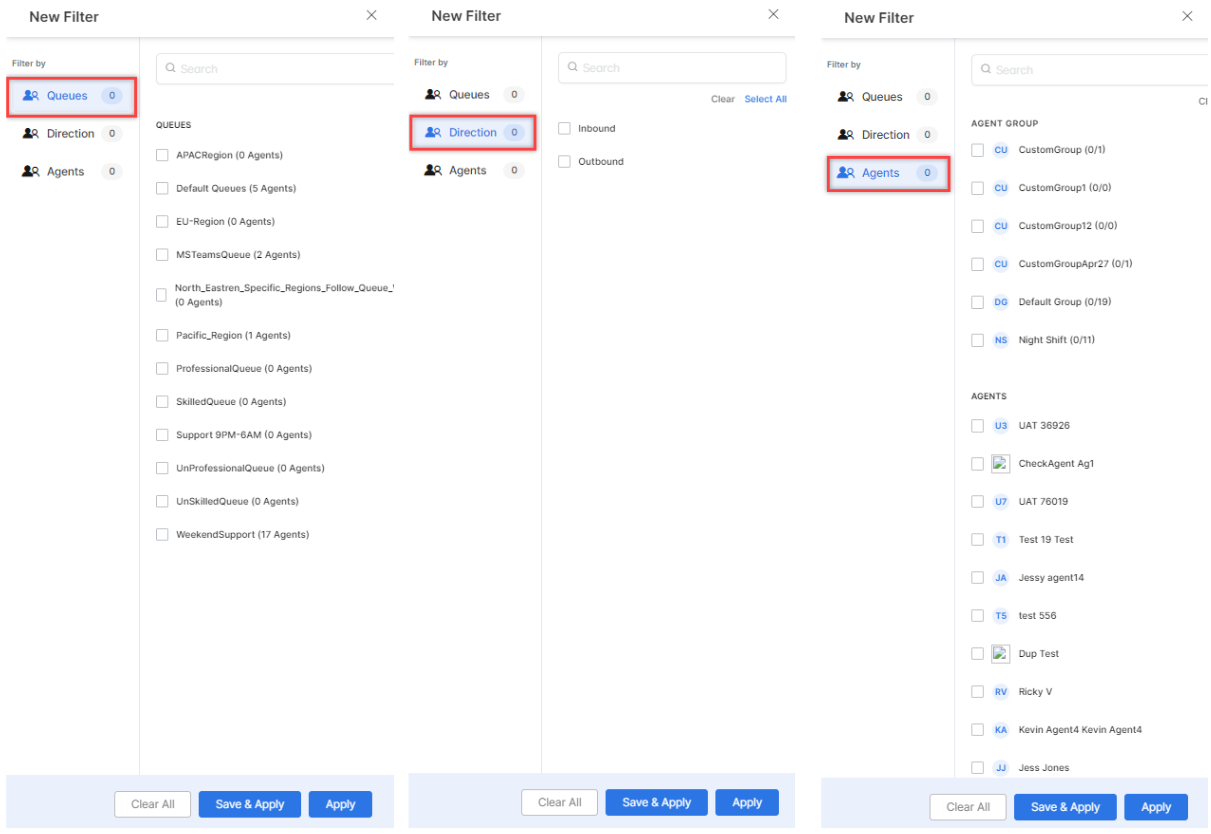
- Click Save & Apply.
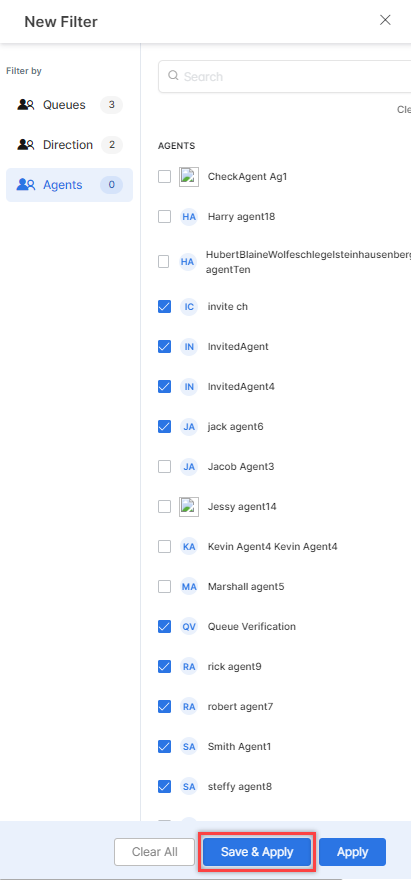
- Enter the Filter Name and click Save & Apply.
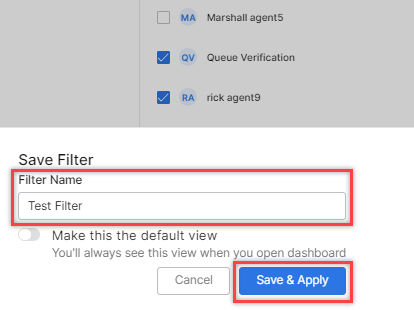
A confirmation is displayed.

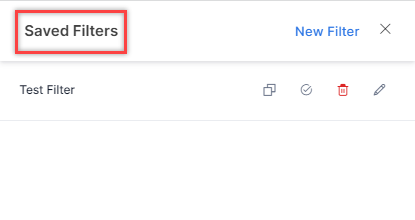
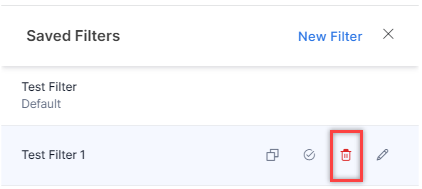
Saved Filters
You can view the saved filters by clicking the filters tab.
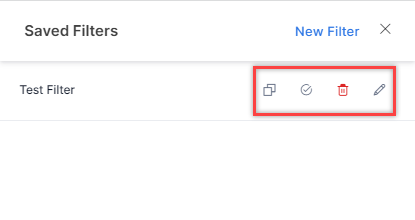
Hovering over a saved filter displays the following options:
- Copy
- Mark as Default
- Delete
- Edit
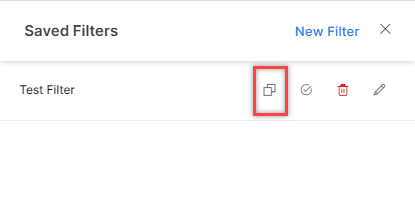
Copy Filter
Steps to copy a filter:
- Click the Copy button on the filter that you want to copy.
- Enter a Filter Name for the new filter and click SAVE.
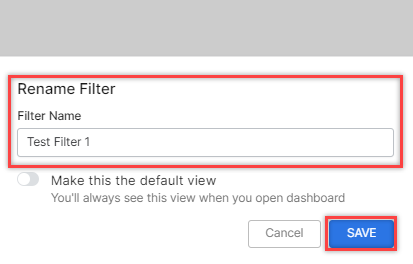
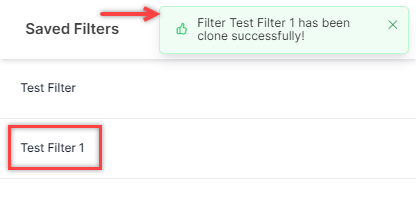
- A confirmation is displayed, and a copy of the filter is created.
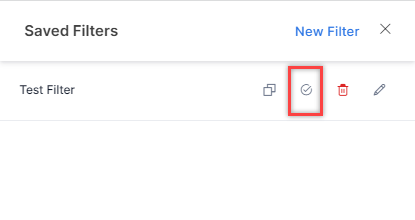
Mark as Default
Click the Mark as Default button to set the filter as the default filter.
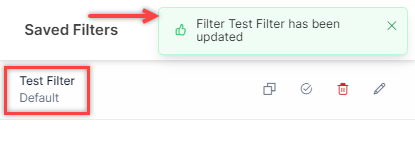
A confirmation is displayed, and the filter is set as the default filter.
Delete Filter
Steps to delete a filter:
- Click the Delete button.
- On the delete confirmation pop-up window, click Delete.
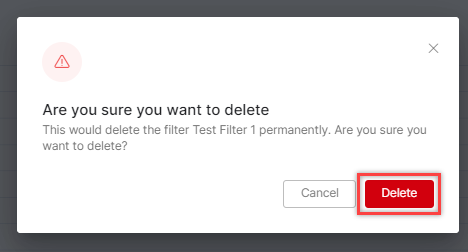
A confirmation is displayed, and the filter is deleted.
Edit Filter
Steps to edit a filter:
- Click the Edit button.
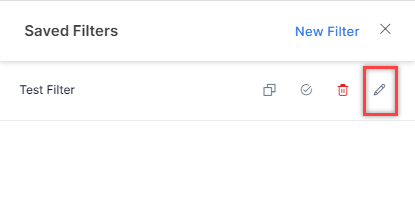
- Make the necessary changes and click Save & Apply.
A confirmation is displayed.
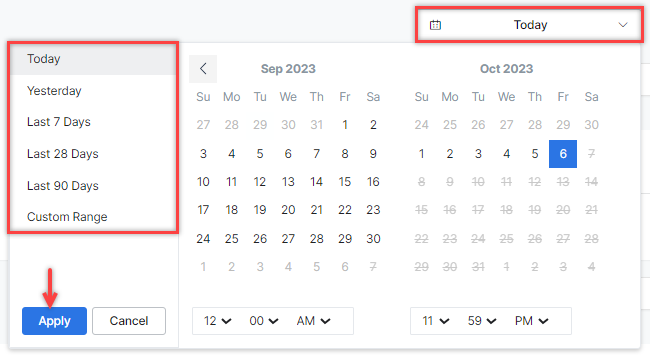
Time Selection
You can filter data for a specific time range. You can choose a particular time range and click Apply.
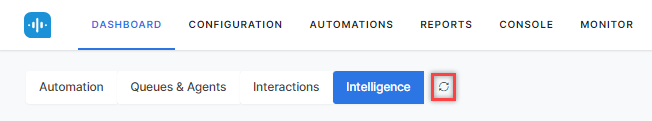
Intelligence Tab Refresh
You can refresh the intelligence tab by clicking the Refresh button.
Channels
You can filter the data by channels (All, Voice, Chat, and Email). This filter applies to the entire dashboard except for agent occupancy since occupancy per channel is not tracked.
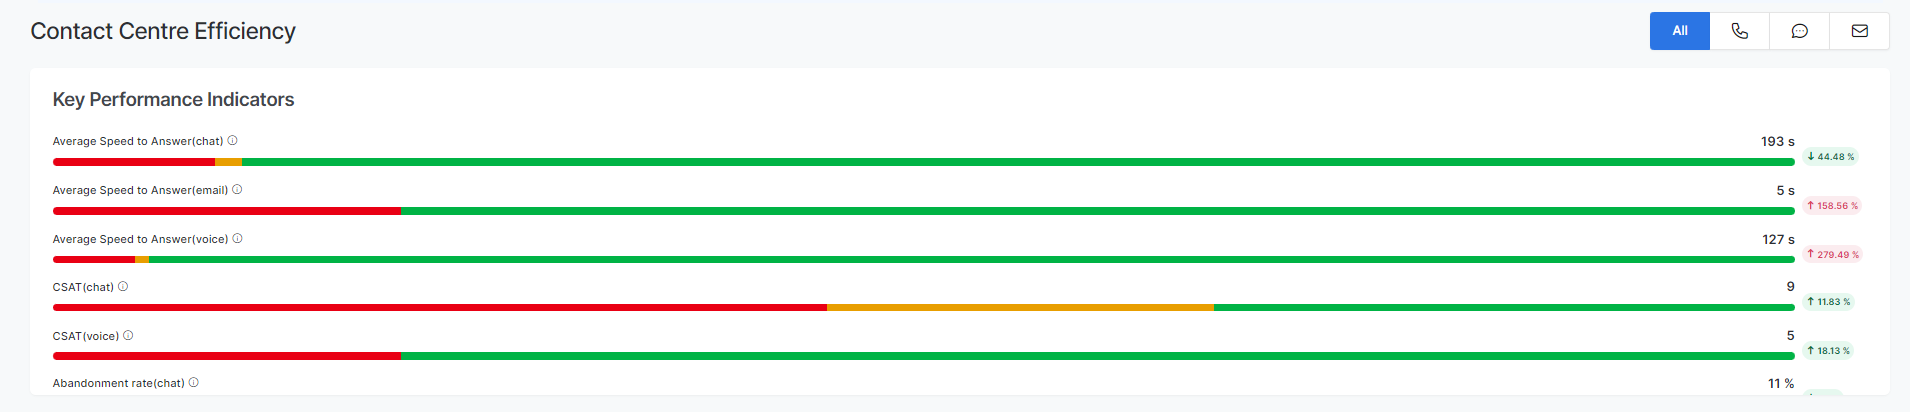
Contact Center Efficiency
Key Performance Indicators
Efficient contact centers are the backbone of excellent support. To ensure teams are maximizing productivity and efficiency, managers use key performance indicators. Key Performance Indicators (KPIs) in a contact center environment are measurable metrics used to assess the effectiveness and efficiency of customer service operations. They include:
Average Speed to Answer (Voice, Chat, Email Channels): Average Speed to Answer (ASA) identifies how long it takes an agent to answer inbound calls, from when callers enter the queue.
Abandonment Rate (Voice, Chat Channels): Abandonment Rate is the total number of customers who hang up while waiting to speak with an agent.
CSAT (Voice, Chat Channels): Customer Satisfaction (CSAT) scores indicate customer satisfaction with the support. This can be calculated from CSAT survey scores.
Transfer Rate (Voice, Chat, Email Channels): Transfer rate measures the percentage of customer interactions that were transferred from one agent or queue to another to resolve the issue.
Default Zones for KPIs
- For Average Speed to Answer :
- Voice Channel – Green upto 28 seconds, Yellow 28 to 40 seconds, Red 40 seconds and above.
- Chat Channel – Green upto 35 seconds, Yellow 35 seconds to 50 seconds, Red 50 seconds and above.
- For Transfer Rate :
- Voice and Chat Channels – Green upto 10%, and Red Beyond 10%.
- For Abandonment Rate :
- Voice and Chat Channels – Green upto 6%, and Red Beyond 6%.
- For CSAT: Show the actuals as it is with the respective weight-ages of interactions.
- CSAT is shown as a score in the range of 1-10 (1 is lowest and 1o is highest).
- Green 8 and above, Yellow 6 to 8, and Red 1 to 6.
The average of the KPIs for a time interval is shown beside the line bar along with a percentage increase or decrease in comparison with the period selected.
Hovering on the color zones shows the percentage of calls along with the actual number of calls for the represented percentage (volume).
Agent Efficacy
Empathy Score
Empathy is a crucial necessity for having a quality customer experience. The empathy detection module analyzes both customer and agent utterances happening in one turn and detects if there is a need for empathy. This is done by detecting the sentiment of customer utterance and classifying it either as ’empathy-seeking’ or ‘non-empathy-seeking’.
The empathy module analyzes an agent’s utterance and classifies whether or not the agent is being empathetic.
CSAT
Customer Satisfaction (CSAT) is a widely used metric to measure and evaluate customer satisfaction. This widget displays the average of the CSAT scores given by customers on a scale of 1 to 5.
Crutch Word Score
This measures how frequently an agent uses crutch words during their speech. Crutch words are words or phrases that agents use as a filler or to give themselves more time to think. Common crutch words include “um,” “uh,” “like,” “you know,” “so,” and “basically,”. The crutch word score is calculated for agent utterances only.
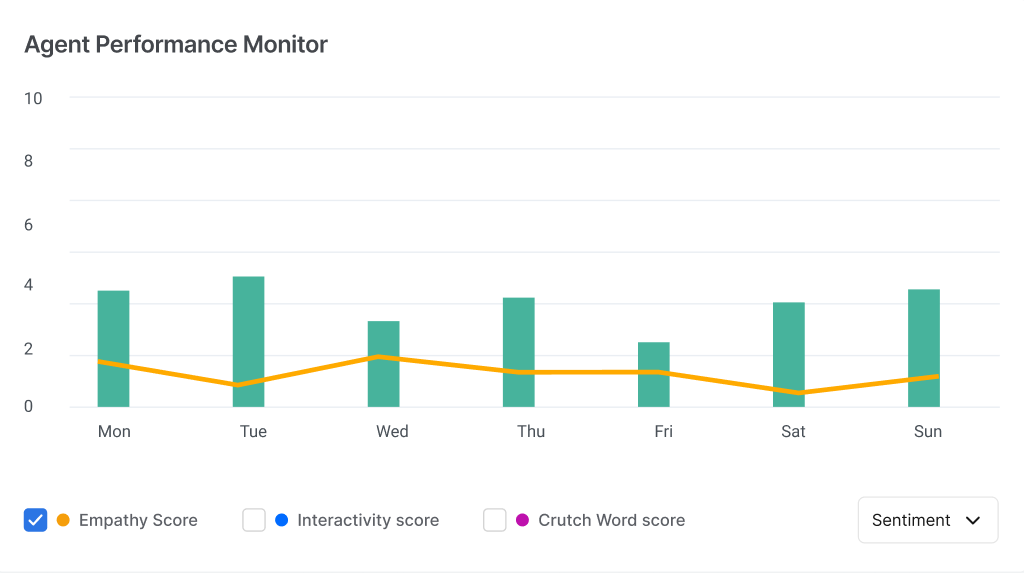
Agent Performance Monitor
The admins and supervisors must completely understand customer interactions and their influence on customer satisfaction. Agent Performance Monitor provides a visual representation that shows the relationships among different metrics, including interactivity score, empathy score, crutch word score, CSAT score, and sentiment score. You can make informed, data-driven decisions by identifying patterns to enhance the overall customer experience.
The agent performance metrics are on the Y-axis. You can select individual metrics, or multiple selections are allowed to visualize and analyze the metrics. CSAT and Sentiment score are the customer experience-based metrics on the X-axis.
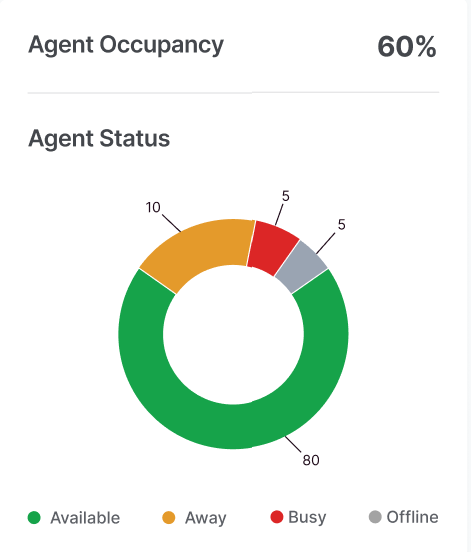
Agent Occupancy and Agent Status
Agent occupancy refers to the time agents actively handle customer interactions or perform work-related tasks like After Call Work (ACW). It represents the amount of time agents spend on productive activities compared to their total available working time.
Agent Occupancy (%) = (Total talk or chat time + Total ACW time) / (Total logged-in time) * 100
Total talk or chat time: The aggregate duration during which agents actively participate in customer interactions, including inbound and outbound calls or chats.
Total ACW time: The cumulative duration agents engage in post-call activities, including ACW, note-taking, updating customer records, or completing essential tasks linked to the interaction.
Total logged-in time: The combined duration agents remain logged into SmartAssist, available to handle customer interactions.
Agent statuses include available, busy, away, “break, and other custom codes the administrator configures. This information is represented in a pie chart, enabling admins and supervisors to quickly assess the distribution of agents across various statuses. This section also helps in understanding agent occupancy and optimizing agent utilization.
Agent Playbook Adherence
Agents follow predefined scripts when handling customer interactions. These scripts are part of either the static playbooks configured in AgentAssist or business process-specific scripts configured in the dynamic playbooks in AgentAssist. Supervisors can track agents’ adherence to the configured scripts.
The adherence is presented as a bar graph, with each attribute represented by individual bars indicating the compliance percentage for the selected period.
The compliance percentage for each attribute is displayed beside the graph, along with an indication for an increase or decrease in compliance percentage during the selected period compared to the same time range. For example, if a supervisor views the compliance scores for the last week, the percentage increase or decrease is indicated for the previous week. Similarly, if the supervisor selects a one-month time frame, the comparison period is one month.
When the playbook steps are the same across all the different playbook configurations, they appear as the default set of parameters for measuring adherence.
When no Agent Assist playbooks are configured, adherence is displayed for the following parameters (Conversation Etiquettes) by default:
- Greeting. For example: Hello, My name is John Doe and I am your customer support executive. How may I help you today?
- Branding. For example: Thank you for contacting XYZ.
- Privacy Policy. For example: This call is being recorded for quality and training purposes.
- Hold Etiquette (Voice calls). For example: May I place you on hold for a couple of minutes while I pull up some information?
- Customer Verification. For example: Can I know your date of birth?
- Proper Sign Off. For example: Thank you for calling XYZ today. It was a pleasure to assist you. Have a great day!
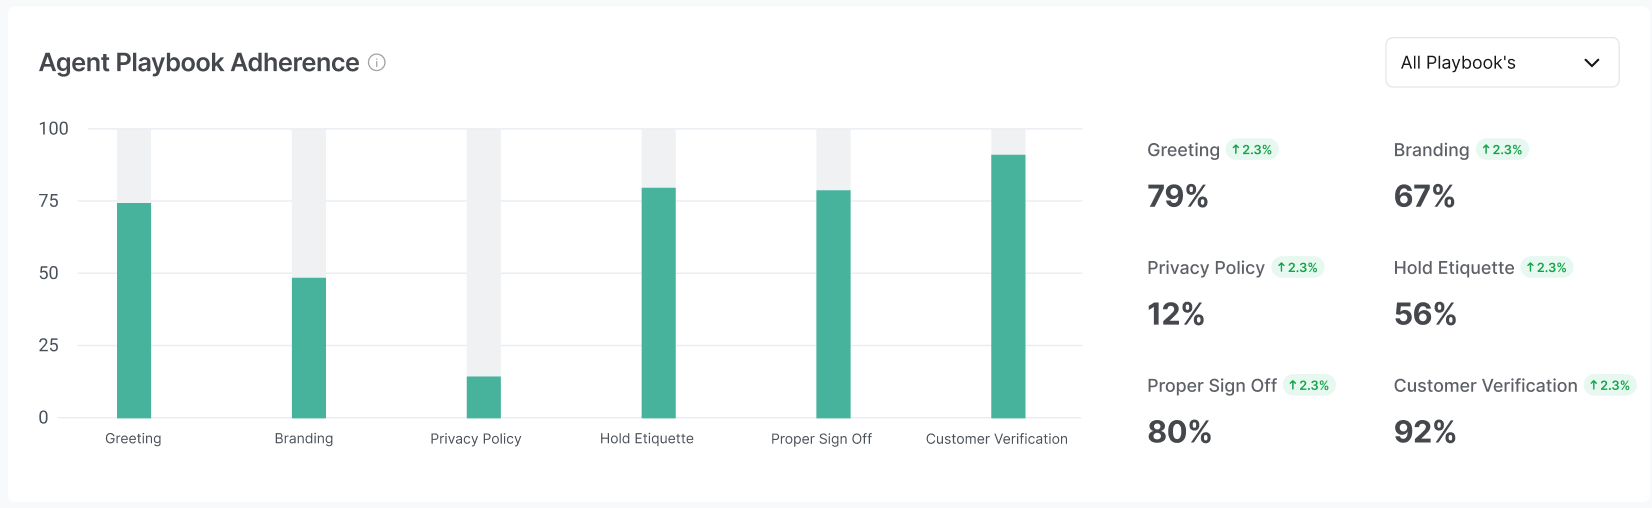
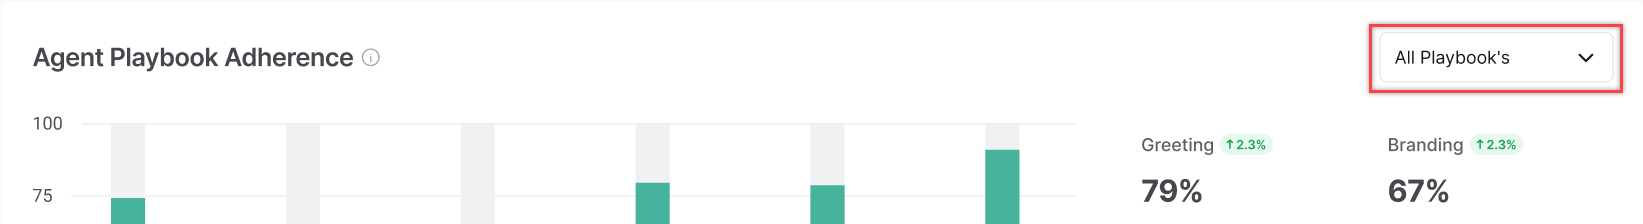
Supervisors can choose specific playbooks from the dropdown menu other than the default options. In that case, adherence to the specific parameters/steps in that playbook is displayed.
Administrators can configure the attributes for agent playbook adherence. Learn more.
Customer Experience
You can monitor and review historical data to assess the customer experience. This in-depth analysis of the metrics results in improved customer experience.
The following parameters can be monitored:
- Average Wait Time: The average wait time is the sum of the total wait time for all customers in a specific period (for example, an hour) divided by the total number of customers served during that period.
- Customer churn %: Customer churn refers to the rate at which customers stop using the services or products provided by the contact center and switch to a competitor or discontinue their engagement altogether. It indicates the loss of customers over a specific period.
- Sentiment score: The sentiment of each customer utterance is assessed in real-time at the keyword/phrase/sub-topic level and stored. Once the call concludes, all the customer sentiments recorded are averaged to compute a sentiment score for the entire call, which is then normalized within the range of 1 to 10.
- NPS Score: The Net Promoter Score (NPS) measures customer loyalty and satisfaction. It is determined through a survey question that asks customers to rate, on a scale from 0 to 10, how likely they are to recommend the products or services to others.
- Sentiment score: It is a numerical representation of the sentiment or emotion expressed during the interaction, such as a comment. The goal is to determine the overall sentiment or attitude conveyed in the interaction.

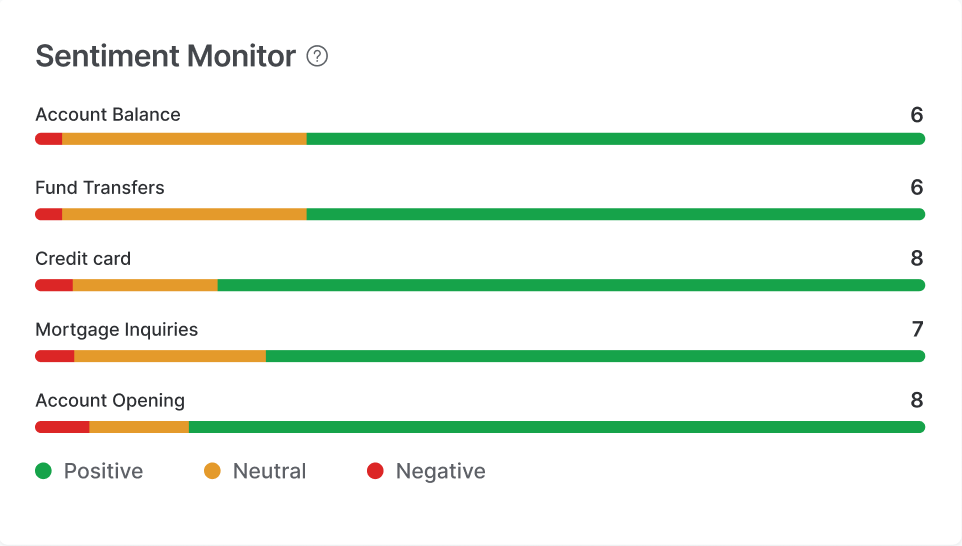
Sentiment Monitor
The sentiment analysis module provides a score range from 1-10 for each interaction and indicates polarity as Positive, Neutral, or Negative. It determines the likely emotion involved based on the average sentiment score, such as Happy, Satisfied, or Disappointed.
The sentiment monitor graph shows the distribution of customer sentiment across different intents, enabling an admin to understand customer satisfaction and sentiment levels related to specific intents or topics of conversation.
The sentiment monitor graph is a bar chart where each bar represents an intent or topic. Each bar represents the associated sentiment across all interactions with that intent, categorizing the sentiment weightage as follows:
- Positive sentiment – Green color
- Neutral sentiment – Yellow color
- Negative sentiment – Red color
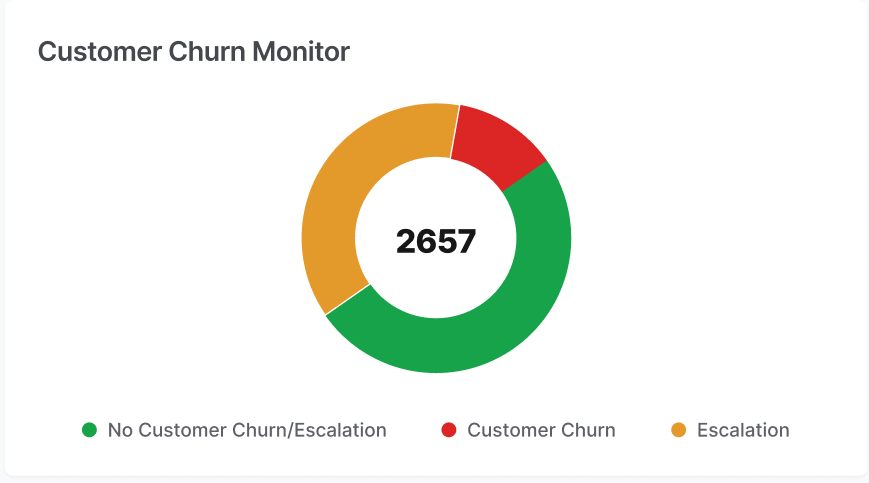
Customer Churn Monitor
It’s a pie chart that visualizes the proficiency of churn risk. This chart indicates customer churn percentage compared with total calls and any observed escalations in the same period. It functions as an interactive graph, where hovering over the graph reveals the weightage of each section based on the hover placement, and clicking a specific section directs to the calls associated with either escalation or customer churn. The following details are displayed:
- No Customer Churn/Escalation – Number of interactions where there was no customer churn/escalation.
- Customer Churn – Count of interactions where there has been a customer churn.
- Escalation – Number of interactions where the customer has requested assistance from a supervisor or a senior.
Insights Mining
The insights mining dashboard comprises three widgets that facilitate data exploration.
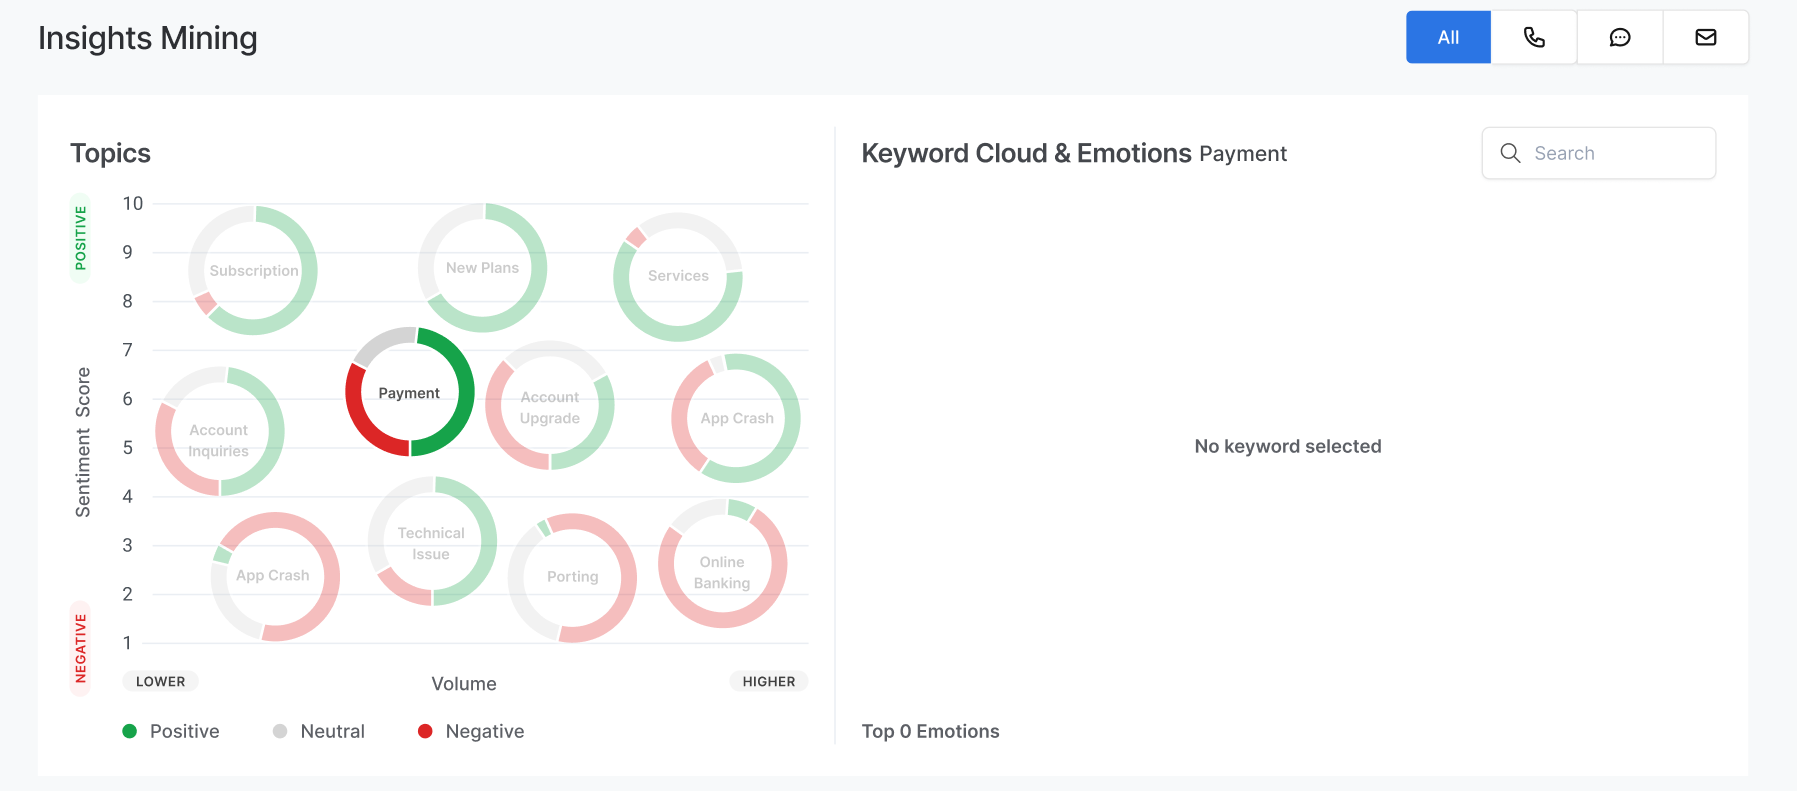
Topic vs.Sentiment Bubble
The widget grades sentiment scores on a scale of 1-10 for interactions. Each topic is represented by a bubble with indicators for different weights associated with positive, neutral, or negative sentiment.
Hovering over a topic displays the associated average emotion index label (for example, angry or frustrated) in place of the topic name.
For example: The “Network issues” bubble indicates sentiment distribution as follows:
40% positive (green), 30% neutral, and 30% negative. These percentages are represented by the bubble’s circumference. Hovering over “Network issues” shows the average emotion index, such as “satisfied” (associated with the average sentiment score).
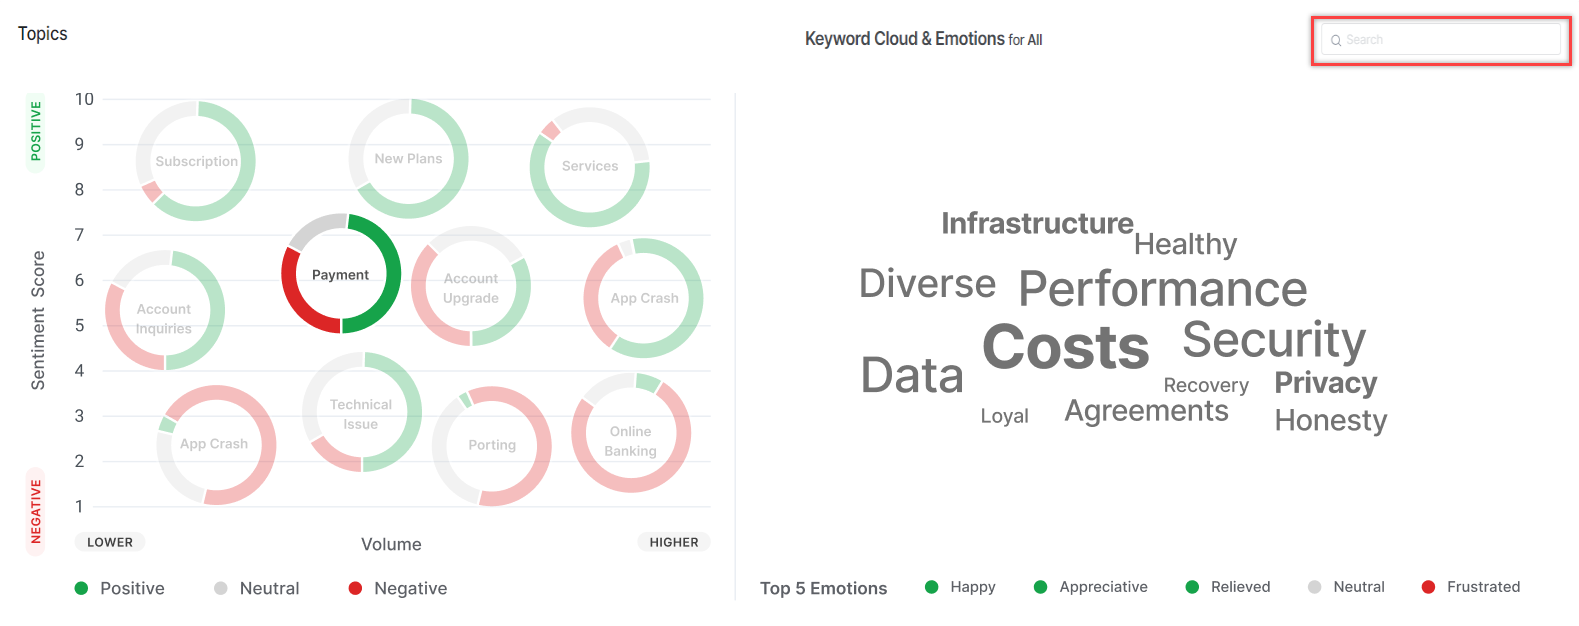
Keyword Cloud & Emotions
This widget shows relevant keywords for a selected topic from the previous widget. It excludes general stop words and common words.
Keyword Search
Supervisors can search specific keywords across interactions related to a chosen topic from the topic bubbles using the keyword search.
You can select a particular topic from the dropdown list or choose all topics to search for a keyword. The total mentions of the keyword and the total number of unique interactions where the keyword is displayed on hovering over the keyword.
If a specific topic bubble is selected, the relevant topic is automatically chosen in the topic dropdown. The searched keyword appears in the selected topic bubble or the selected topic from the dropdown.
When “all topics” are selected from the dropdown, the topic bubble is deselected, and it displays the keywords and interaction details across all topics.
Selecting a specific topic from the dropdown selects the relevant topic bubble, and only the pertinent keywords are shown for that topic.
If a keyword is present in multiple topics, the keyword count and interaction mention the specific topic’s relevance.
When searching for a keyword, only that specific keyword appears in the keyword cloud. Relevant semantic keywords, if available, are displayed in the keyword cloud.
The interaction details refer to the main keyword searched, and if any semantic variations are present, the interaction details are shown after the complete set of interactions for the specific keyword searched.
In the case of selecting a specific semantic variation keyword in the keyword cloud, the interactions related to that keyword are displayed in the interaction details.
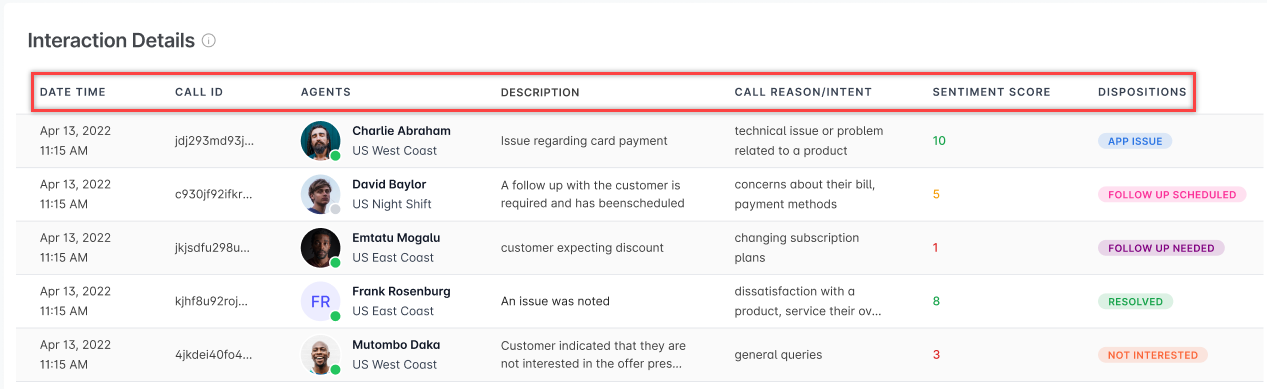
Interaction Details
Interaction details display the relevant details based on default settings that you can configure. When you select specific topics or keywords, the widget presents the relevant information, or if no specific selection is made, it displays information based on the highest sentiment score or other user-configured settings.
This section includes the following fields:
- Date/Time of the session
- Call ID
- Agent name/ID (you can choose from a dropdown list of agent groups/agents)
- Description (text reference to the keyword cloud)
- Call Reason/Intent
- Sentiment Score (configurable from high to low)
- Dispositions