
SmartAssist allows contact center agents to track their activity, performance, and customer satisfaction data.
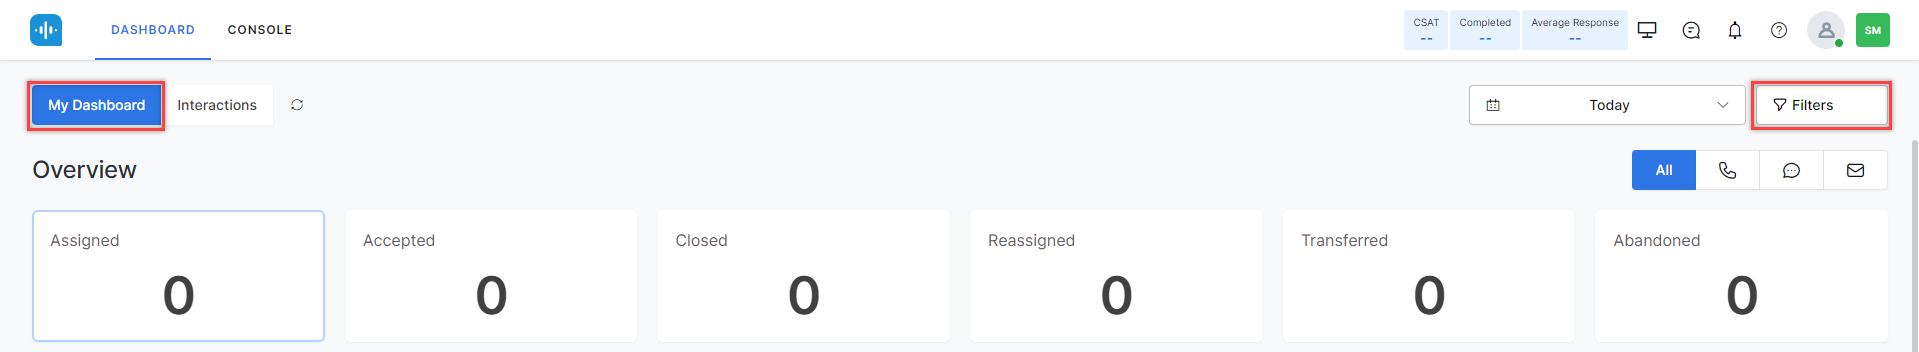
Agents can access the Dashboard by clicking the DASHBOARD tab.
![]()
My Dashboard
This dashboard is the default dashboard for every agent. The following sections display data related to the agent’s activity and performance.
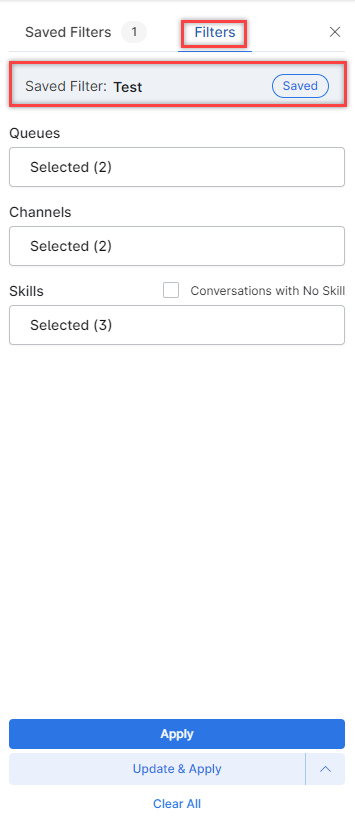
Filters
You can click the Filters button on my dashboard tab to filter the following data:
Skills: By default, the system displays all interactions. You can choose All Skills, No Skills, or select required skills.
Create and Save Filter
Steps to create and save a filter:
- Click the Filters button in the upper-right corner.
- Click the Saved Filters tab and then click Create Filter.

- Select the Queues, Channels, and Skills.
Conversations with No Skill: Selecting this option displays conversations without skills assigned.
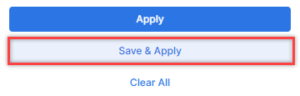
Select from the below available options:
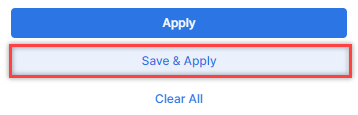
- Apply – Applied for one instance and not saved.
- Save & Apply – Saves the filter, and it appears when selected.
- Clear All – Clears all selections.
- Click Save and Apply.
- On the pop-up window, enter a name for the filter and click Save.
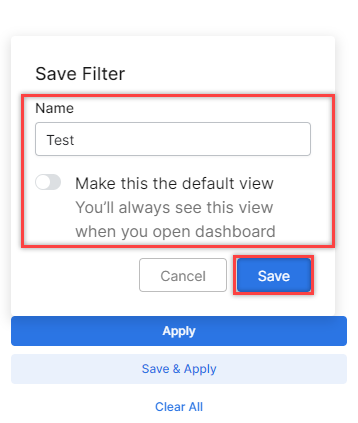
A confirmation message is displayed.
Update Filter
Steps to update a filter:
- Click the Filters tab. The Saved Filter name appears with the current status of the filter (Saved).
- You can make the required changes. The filter status changes to Unsaved.
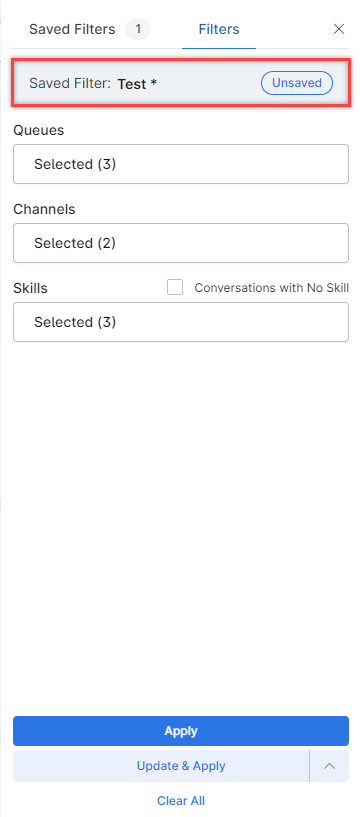
- Click Update & Apply to update the existing filter, or click the ^ button beside the Update & Apply button. The following options are displayed:
- Save As – Save the changes as a new filter.
- Reset – Undo the recent changes.

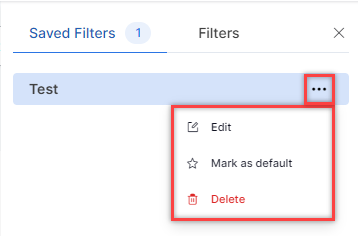
Edit, Mark as default, Delete Filter
Steps to Edit, Mark as default, or Delete a Filter:
- Click Filters and then click the Saved Filters tab.

- Click the ellipsis (…) button beside the filter. The following options are displayed:
- Edit – Edit the filter.
- Mark as default – Make the selected filter the default filter.
- Delete – Delete the filter.
Channels
By default, the system displays interactions of all the channels. You can choose specific channels (Voice, Chat, Email) to view interactions.

Queues: By default, the system displays interactions of all the queues. You can choose specific queues to view interactions.
Time Selection
You can filter the dashboard data for a specific time range by choosing from the following options and clicking Apply.
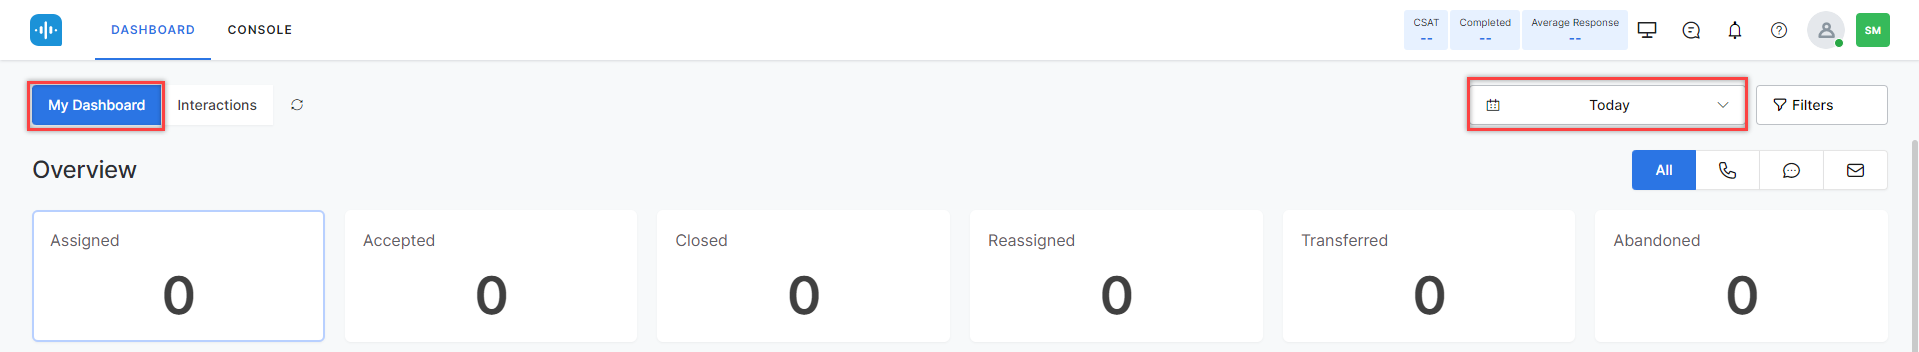
- Today: Displays all data for the current day in the agent’s time zone.
- Last 7 days: Displays all the data for last 7 days (excluding the present day) in the agent’s time zone.
- Last week: Displays all data for the previous week (from Sunday 12:00:00 AM to Saturday 11:59:59 PM) in the agent’s time zone.
- Last 30 days: Displays all data for the previous 30 days (excluding today) in the agent’s time zone.
- Month to date: Displays all data from the beginning of the current month up to the present in the agent’s time zone.
- Custom: Allows agents to specify a custom date range, from 12:00:00 AM on a given start date to 11:59:59 PM on a given end date, within a 31-day limit, in the agent’s time zone.
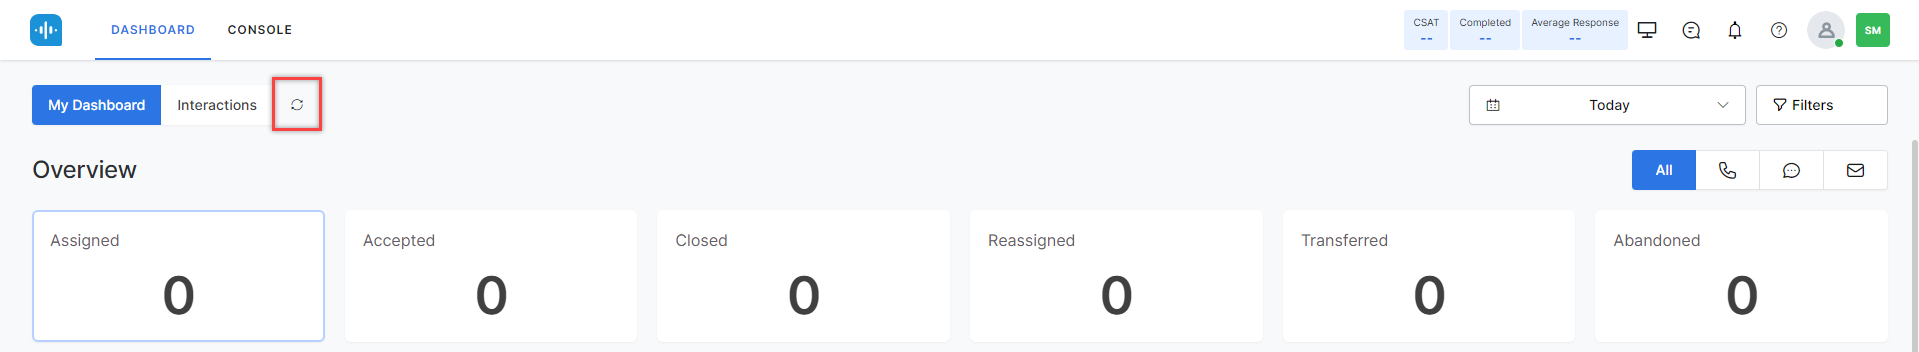
My Dashboard Tab Refresh
You can refresh the My Dashboard’s data by clicking the Refresh button.
Overview
Assigned: Represents the number of interactions assigned to the agent by the system, a supervisor, or another agent.

Accepted: Displays the number of accepted interactions by the agent.

Hovering over the widget displays the following information:
- Avg. Accepted Time: Sum of the time taken to accept the interactions divided by the number of accepted interactions.
- ConversationsResponded to: Number of accepted interactions where the agent responded at least once.
Closed – Closed – Number of interactions closed by the agent, excluding the conversations abandoned while interacting with an agent.
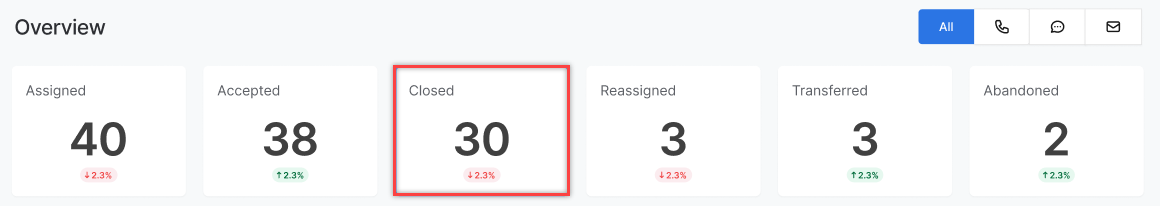
Hovering over the widget displays the following information:
- Avg. Close Time – Sum of the time taken to close the interactions divided by the number of closed interactions.
- Avg. close per hour – Count of interactions closed by the agent divided by the number of hours online.
- Closed by Agent – Count of interactions where the agent terminated the conversation.
- Closed by Customer – Count of interactions where the customer terminated the conversation.
Reassigned: Indicates the number of interactions that were reassigned by the system.

Hovering over the widget displays the following information:
- Due to Inaction: Count of interactions reassigned by the system because the agent did not respond within the expected time frame.
- Other Events: Count of interactions reassigned by the system due to events such as network failures, socket connection issues, and similar incidents.
These details provide insights into the reasons for which the system reassigned interactions.
Transferred: Displays the number of interactions that the agent has transferred.
![]()
Hovering over the widget displays the following information:
- Direct to Agent: Count of interactions that the agent directly transferred to another agent, bypassing a queue.
- Into Same Queue: Count of interactions that the agent transferred back to the same queue that was initially assigned.
- Into Another Queue: Count of interactions that the agent transferred to a queue other than the one initially assigned the interaction.
These details offer insights into how and where the agent transferred interactions.
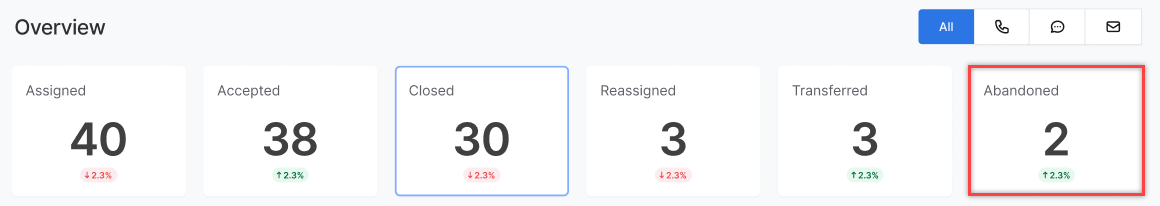
Abandoned: Count of interactions customers abandoned while interacting with the agent.
Efficiency
Average Satisfaction Rating: Average Satisfaction Rating is the sum of all CSAT scores divided by the count of customer interactions where a CSAT score exists.

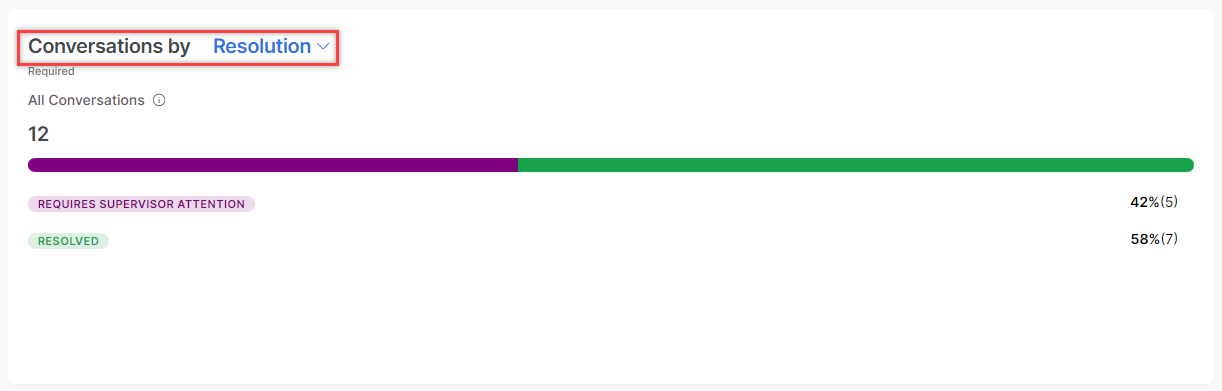
Conversations by Resolution: Count of conversations that are assigned a disposition code by the agent, categorized by each disposition set.
Total Conversations includes all conversations assigned a disposition code by the Agent.
This information displays the distribution of conversations based on resolution categories and provides an overall count of such conversations for the agent.
Occupancy Rate: Calculates the agent’s occupancy (in percentage) as follows:
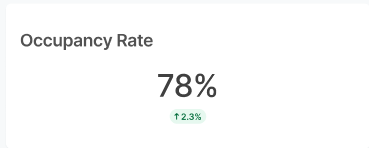
Hovering over the widget displays the following agent statuses:
- Occupancy during Available: This represents the total time spent interacting and in post-call work during the “Available” status, divided by the total time this agent was in the “Available” status.
- Occupancy during Busy: This indicates the total time spent interacting and in post-call work during the “Busy” status, divided by the total time this agent was in the “Busy” status.
- Occupancy during Away: This shows the total time spent interacting and in post-call work during the “Away” status, divided by the total time this agent was in the “Away” status.
This information displays the agent’s occupancy percentages during different availability states
Concurrency Rate:
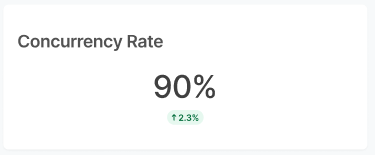
For Agents with Chat-only enabled:
Concurrency rate is not shown for agents who have voice enabled either alone or with chat.
For Agents with both Voice and Chat channels enabled: This widget is disabled.
Voice Metrics: The following voice conversation metrics are displayed in this section:
- Avg Handle Time
- Average Speed to Answer
- Avg Pick-up Time
- Avg Engagement time
- Avg Talk Time
- Avg. Hold Time

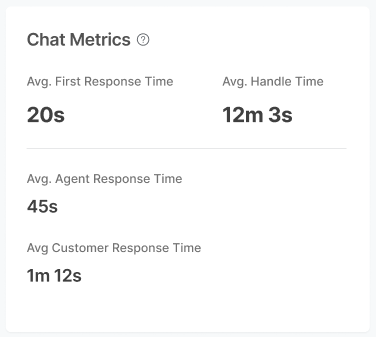
Chat Metrics: The following chat conversation metrics are displayed in this section:
- Avg First Response Time
- Avg Handle Time
- Avg. Agent Response Time
- Avg Customer Response Time
Transfers: The following transfer metrics are displayed in this section:
- Transfer Rate
- Total Transfers
- Call Transfers
- Chat Transfers

Activity
Agent activity: Displays status-wise online time spent by the agent.
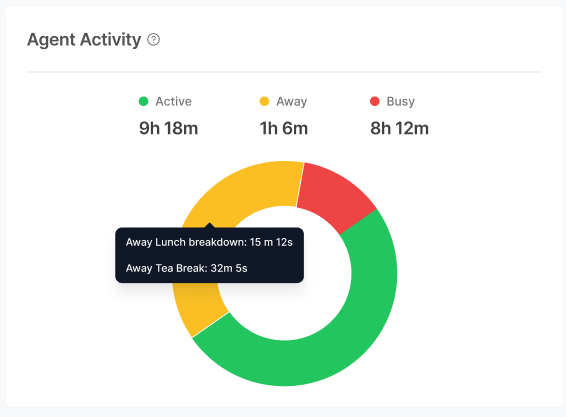
Available: Total time spent by this agent in the Available status.
Away: Total time spent by this agent in the Away status.
Busy: Total time spent by this agent in the Busy status.
Additionally, a pie chart visually represents the distribution of time spent in each of the above statuses.
Clicking any of the built-in statuses (Available, Away, or Busy), displays a breakdown of each built-in status by custom status, providing more detailed insights into how time is allocated within each system status.
Activity Log: Lists events sorted by most recent to least recent for the specified event types.
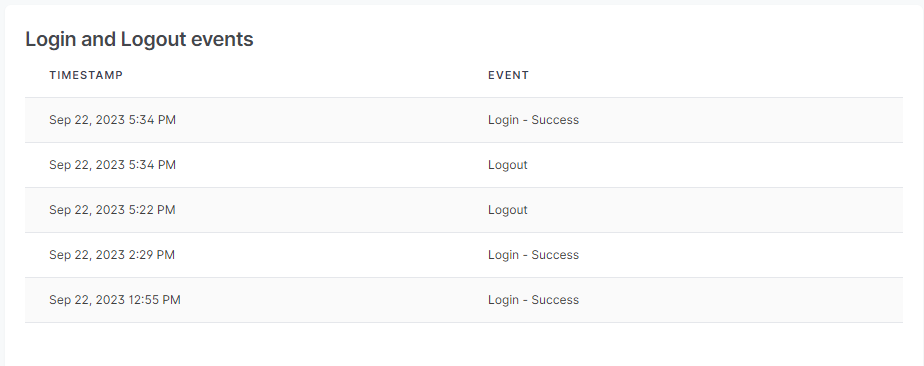
- Login Events (“Login”)
- Logout Events (“Logout”)
- Set to Various Statuses (Manually or Automatically)
This list provides event types, timestamps, and event descriptions for each of the specified event types, sorted in descending order of recency.