The Analytics section provides you insights into the performance of your SmartAssist application for a period of time. With this section, users can get a complete understanding of their customers’ traffic patterns, the most common topics that they need help with, a summary of how SmartAssist has performed across automation, deflection and agent transfers, and many more.
The Analytics section is broadly divided into two main sections:
- Sessions Trend – User sessions provide an overview of the customer activity and usage patterns of SmartAssist. You can use this section to get an understanding of the split-across interaction types as well as an understanding of how session volumes vary throughout the selected period.
- Containment Metrics – The containment metrics section provides an overview of the performance of the three scenarios that SmartAssist Use Cases support: automations, drop-offs, and agent transfers. With the containment metrics section, users can answer questions like:
- How long are customers interacting with SmartAssist?
- When do drop-offs occur?
- Are customer intents being identified correctly?
- What are the most common intents that are not being handled?
Sessions Trend
This section highlights the application usage and throughput. Some typical queries like most busy hours, patterns to customer behavior with regards to automation, agent transfer, etc can be resolved in this section.
|
Metrics |
Details |
| Total Sessions | Counts all sessions handled by SmartAssist over the selected date range, subdivided into hourly/daily buckets (depending on the time selection). |
| Hourly Heat Map | Highlights the busy hours of the day. |

Containment Metrics
In SmartAssist, this section includes a summary of the three main interaction methods such as automation, transfers, and deflection along with success/failure metrics.
Containment Metrics is further classified into:
- All Interactions
- Automations
- Drop-offs
- Agent Transfer
All Interactions
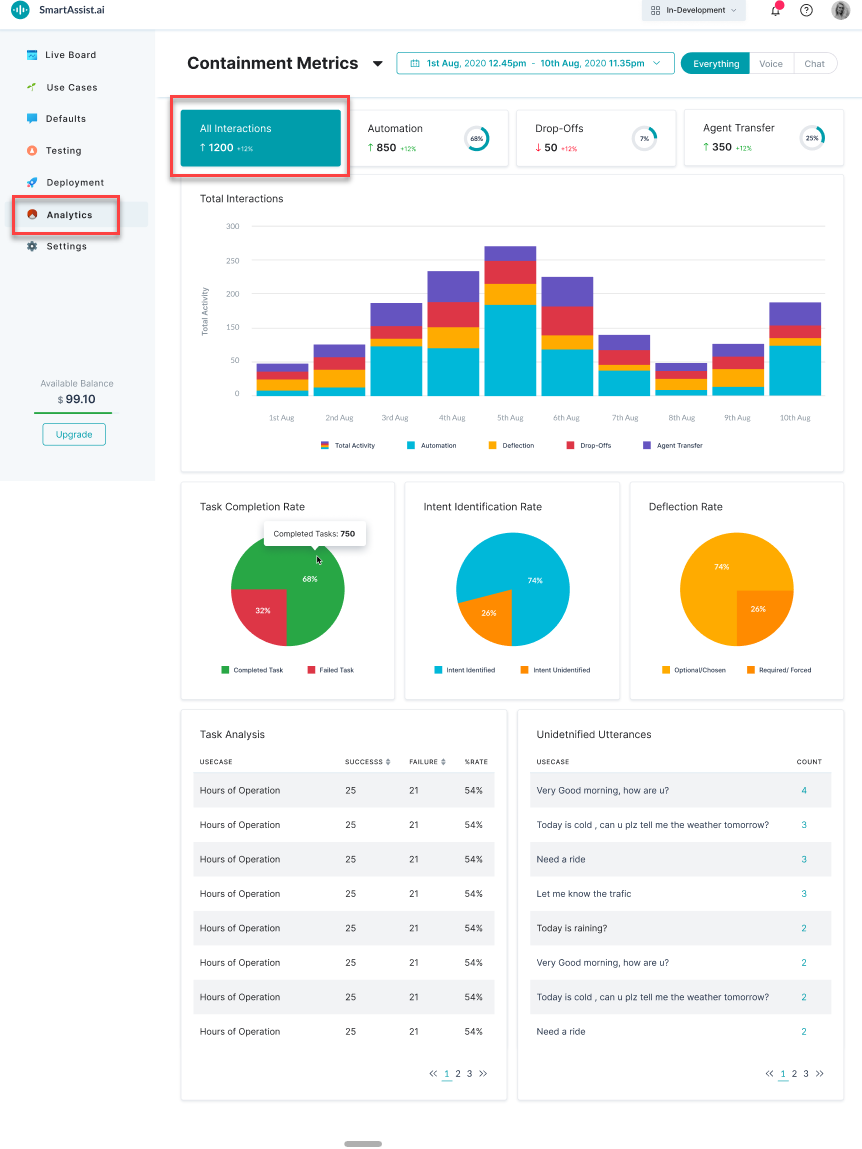
This section provides an overall summary along with Task Completion Rate, Intent Identification Rate, and Deflection Rate.
All Interactions typically answer questions like:
- What percentage of customers are getting their questions answered?
- What percentage of intents are detected correctly?
- Are customers opting for optional deflections?
| Metrics | Details |
| Total Sessions | It counts all sessions handled by SmartAssist over the selected date range, subdivided into automations, deflections, drop-offs, and agent transfers. |
| Task Completion Rate | Split between completed and failed tasks. The higher the number of completed tasks, the better is the completion rate. |
| Intent Identification Rate | Split between sessions where intents are identified or not. It can be used as a proxy for utterances training. |
| Deflection Rate | Split between forced and optional deflections. |

Automations
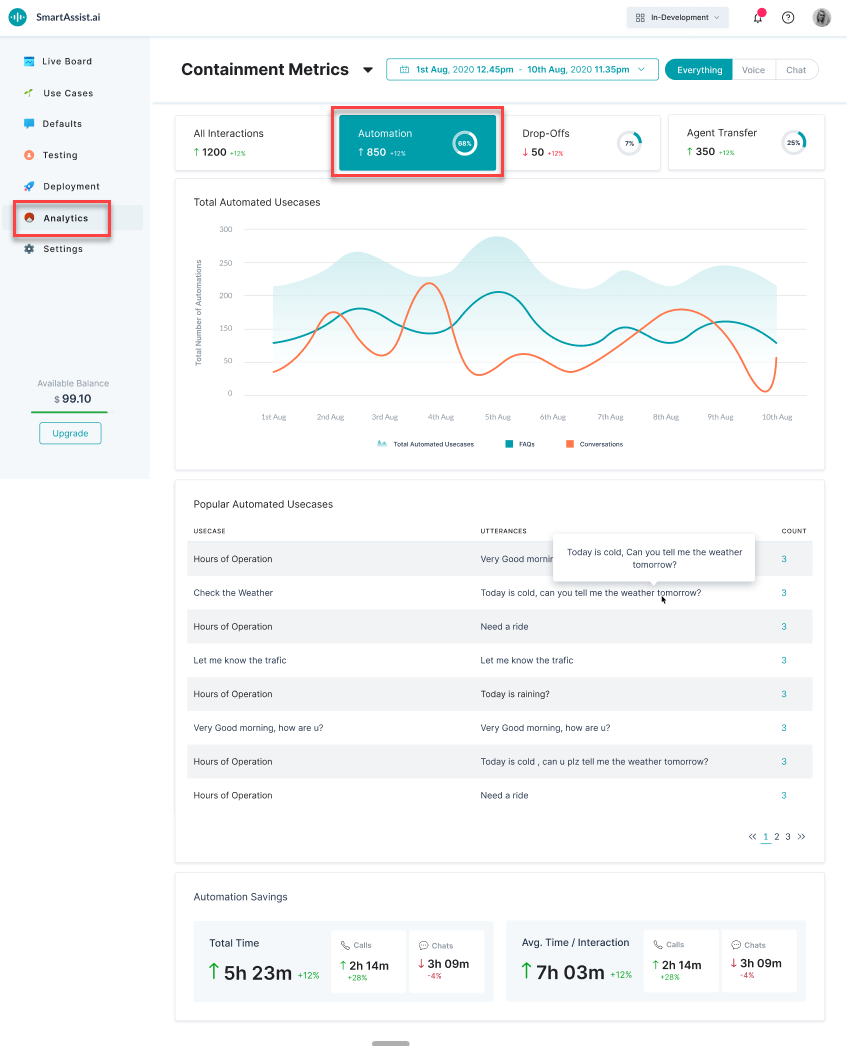
It gives a summary of overall daily automations along with the most popular automations, Total Automation Time, and Average Interaction Time.
Automations typically answer questions like:
- How are automations trending on an overall basis?
- What are the most popular Use Cases?

Drop-Offs
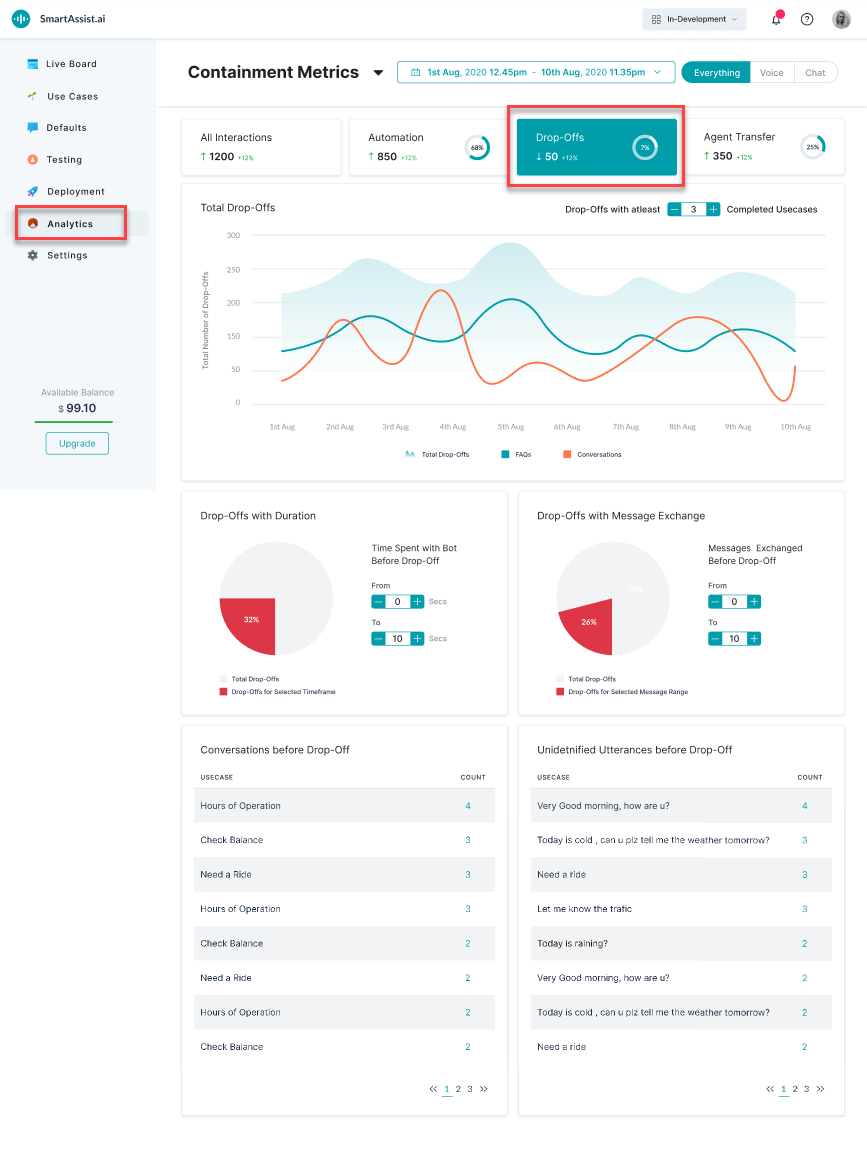
It gives an overview of Drop-Offs along with conversations and unidentified utterances before a drop-off.
Drop-offs are conversations where the intent is left unfulfilled. From the drop-offs section, you can get detailed insights into the drop-off behavior of your customers along with the length of the conversation before the drop-off occurs.

Agent Transfer
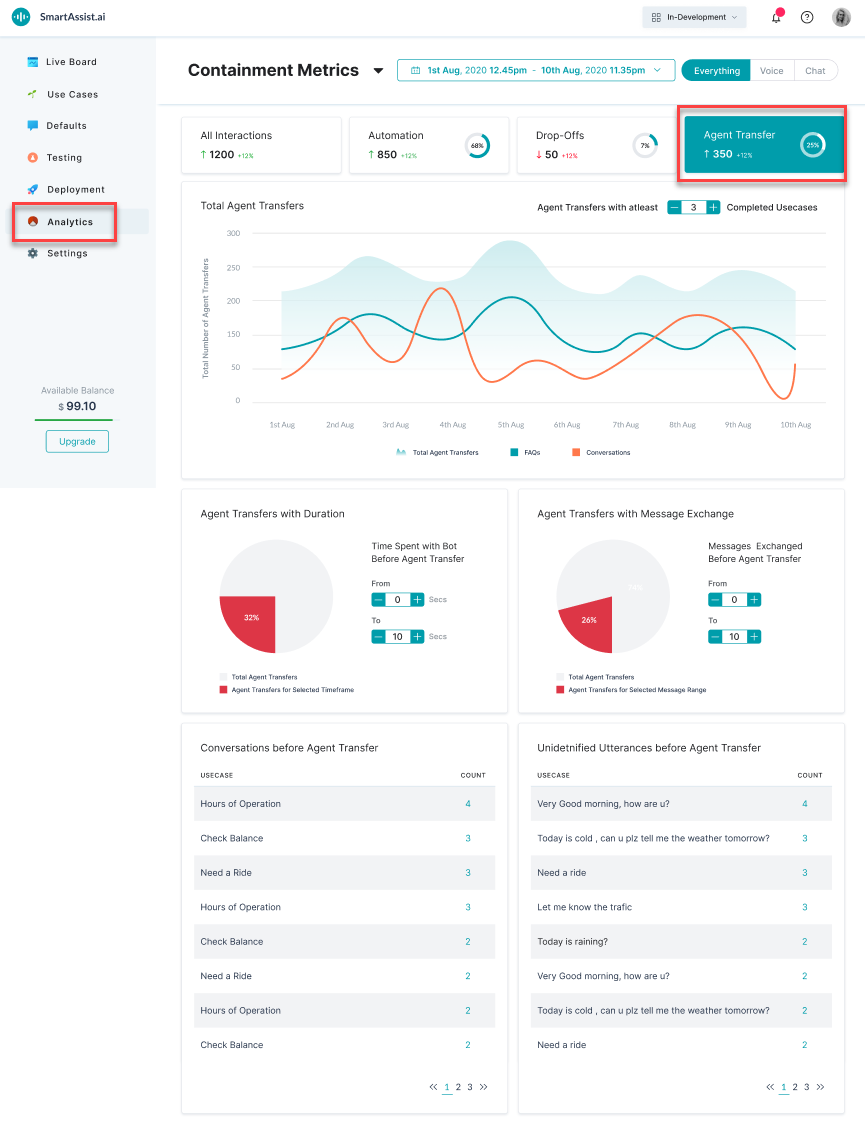
It gives an overview of Agent Transfers along with conversations and utterances captured before agent transfers are invoked.
