GETTING STARTED
Introduction to SmartAssist
Glossary
Minimum System and Browser Requirements
SmartAssist Lifecycle Management
SmartAssist Setup Guide
Sign Up for SmartAssist
Setup SmartAssist for Use With AgentAssist
Release Notes
Recent Updates
Previous Versions
Frequently Asked Questions (FAQ)

EXPERIENCE DESIGNERS
Flow Designer
Introduction
Create Experience Flows
Navigate the Flow Designer
Experience Flow Nodes
Introduction
Node Types
Start
IVR Menu
IVR Digit Input
Conversational Input
Split
Check Agent Availability
Check Business Hours
Message Prompt
Run Automation
Agent Transfer
Connect to API
Go to Flow
Deflect to Chat
Script Task
Set Queue
End Flow
Waiting Experience
Conversation Automation
Testing Widget
Use Cases
Overview
Questions & Answers
Conversations

ADMINISTRATORS
Account Management
Switch Account
Invite Developers to an Account
Routing
SmartAssist Routing
Skills
Skill Groups
Queues
Hours of Operation
Default Flows
User Management
Users
Agent Groups
Agent Settings
Role Management
Agent Status
System Setup
Channels
Voice
Chat
Email
Limitations With Accounts Using AudioCodes
Agent Transfer
Surveys
Agent Forms
Dispositions
Language & Speech
Overview
Language Management
Voice Preferences
Hold Audio
Standard Responses
Widgets
Utils
AgentAssist Settings
SearchAssist
Widget Theming (Layout Customization)
Advanced Settings
Co-Browse Settings
Community WFM (Beta)
Automatic Conversation Summary (Beta)
Intelligent Agent Tools
Reject Calls With a Delayed First Response
API Reference
API Setup
Rate Limits
API List
Integrations
Genesys Voice Bot
Genesys + Kore Voice Automation - Manual Installation Guide
Voice Automation - Integration with Amazon Connect
Voice Automation NiceCX (CX One) - SIP Integration
Talkdesk Voice Automation
Kore Voice Automation (IVA) Integration with Zoom Contact Center (CC)
ID R&D Integration With Kore
Audit Report

AGENTS
Agent Console
Introduction
Conversation Tray
Incoming Interactions
Interacting with Customers
Additional Tools
My Dashboard

SUPERVISORS
Dashboard
Automation
Queues and Agents
Interactions
Monitor Queues, Agents, Interactions, and Service Levels
Manage Layout

BUSINESS USERS
Reports
Introduction
Reports List

Overview

SmartAssist Dashboard lets a contact center agent track their tasks and performance metrics for conversations under DASHBOARD > AGENTS > Overview. 

Analytics for agent conversations in SmartAssist is divided into two sections:

  1. All Analytics: Displays key parameters related to conversations, necessary for agents to track their performance for a selected time period.
  2. All History: Displays a history of conversations between agents and customers for a selected time period.

Dashboard Filters

The dashboard filters allow you to customize the data to suit your requirements. These filters are common for both sections.

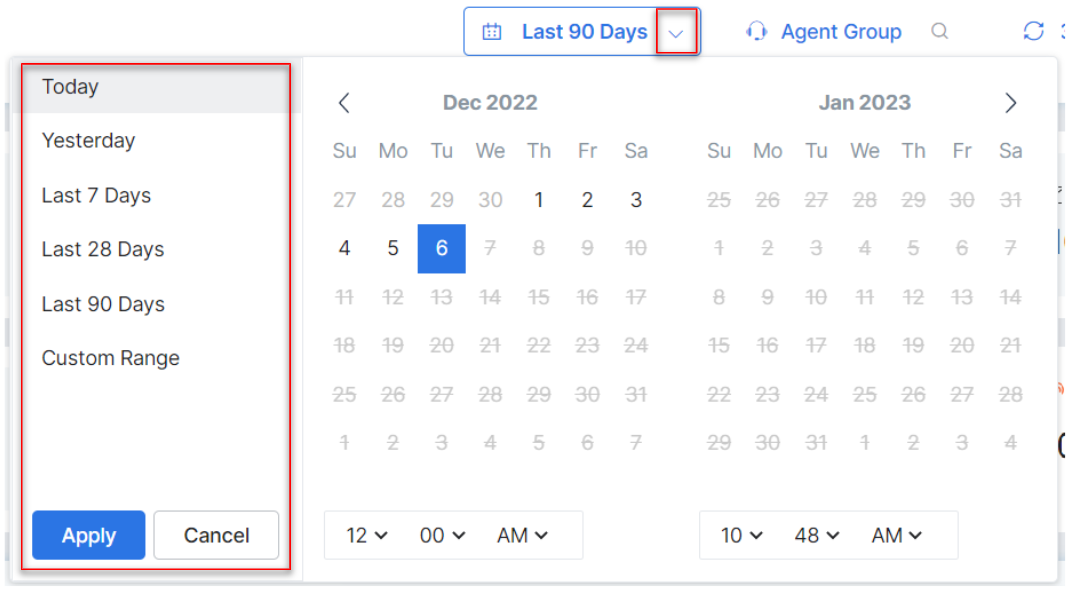
Time Selection

You can filter dashboard data for a specific time period. You can choose a particular time period and click Apply.
Agent Group

You can use the Agent Group filter to select a group of agents to view their metrics. This can be done as follows:

  1. Click the Agent Group button on the top of the Dashboard. The list of agents is displayed.

  2. Select the agents and click Apply.
  3. The count of selected agents is displayed.

Refresh

The Refresh status is located at the top right corner of the Dashboard. The page automatically refreshes every 3 minutes.

To manually refresh the dashboard, click the Refresh status.