
Generating Queue Metrics Summary Report
Queue Metrics Summary Report is a summary of queue load, and performance information calculated daily.
To generate Queue Metrics Summary Report:
- On the Reports tab, click New Report.
- In the list of reports, choose the Queue Metrics Summary Report.
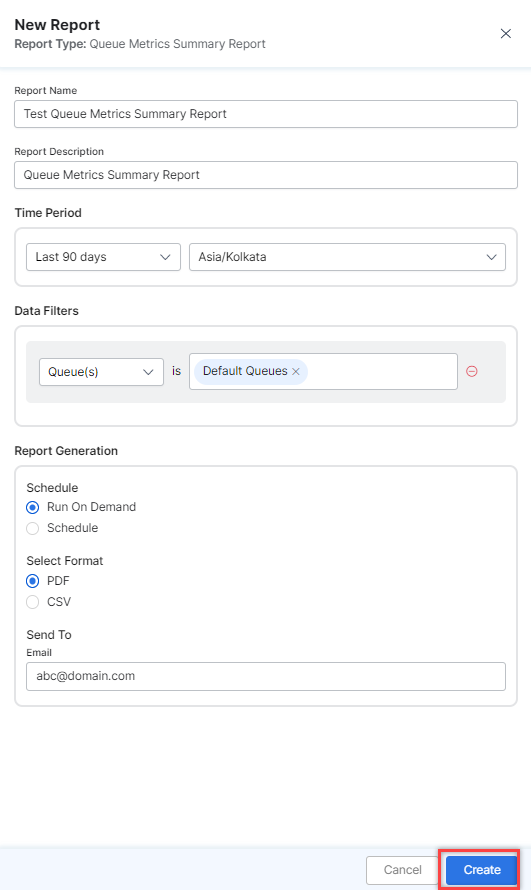
- Enter the Report Name and Report Description.
- Select a Time Period.
- Select Data Filters.
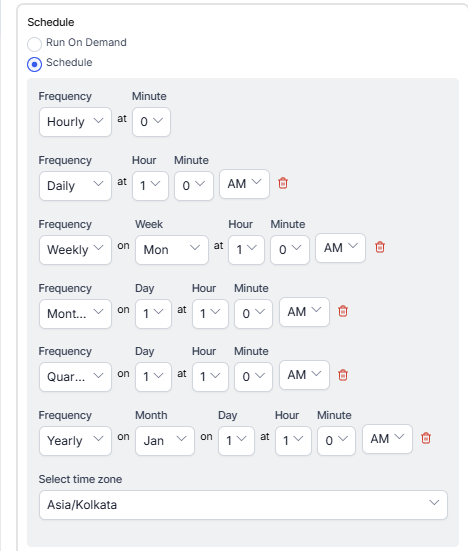
- Select Report Generation and choose from the following options:
-
- Schedule
- Run On Demand
- Schedule
- You can create up to six schedules (only one if you select Hourly).
- You can create up to six schedules (only one if you select Hourly).
- Select Format
- CSV
- Send To (single email address or a mailing list).
- Schedule
-
- Click Create.
- An instance of the Queue Metrics Summary Report is generated.
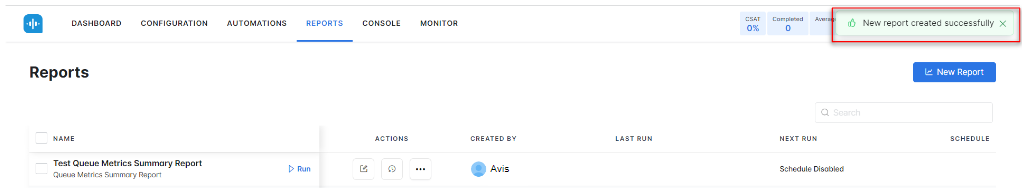
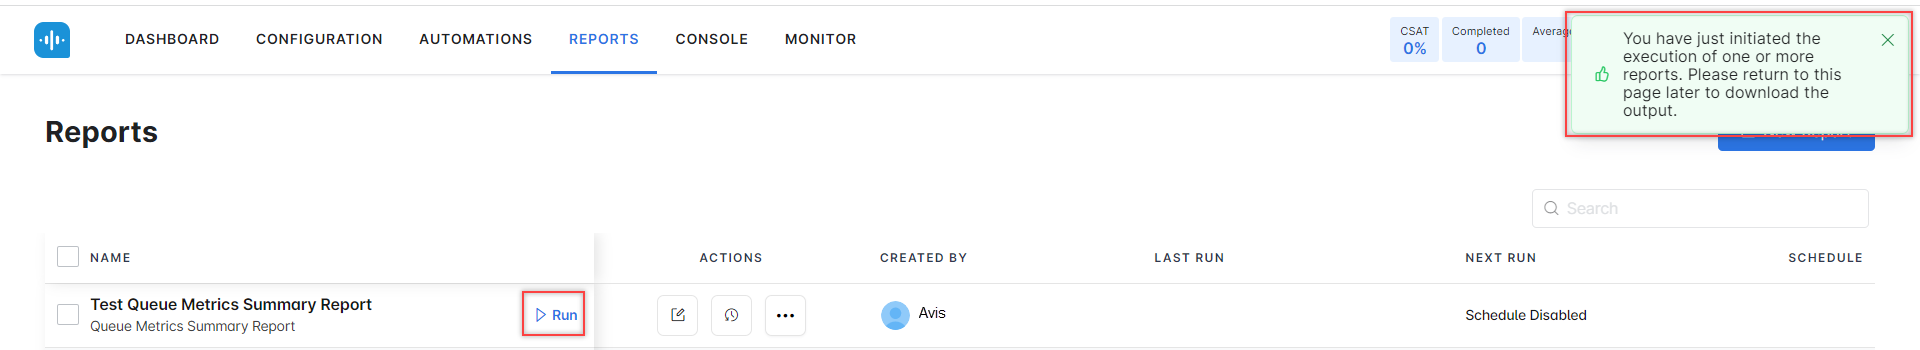
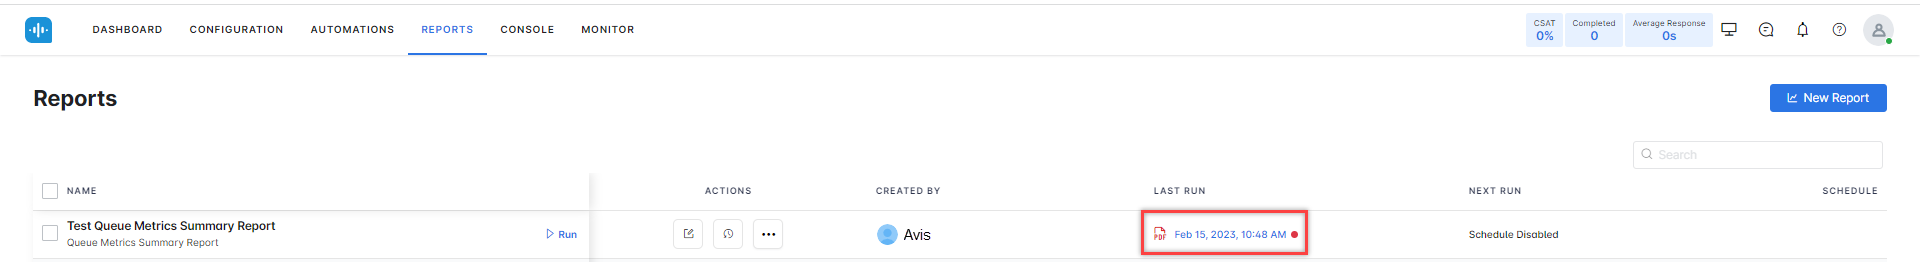
- Click the Run icon next to the instance of the report.
 While generating reports you have two options, Run On Demand and Schedule.
Run On Demand: While creating a new report or editing an existing report, the schedule of the report can be set to run on demand.
Schedule: While creating a new report or editing an existing report, the schedule of the report can be changed. The use of the schedule is the standard way to generate a report. If the report is scheduled for later then it will automatically be generated on the scheduled day and time without the need to click Run. - Click the PDF icon and generate the output of that report, as shown below.
The Queue Metrics Summary Report is generated and is available for download.
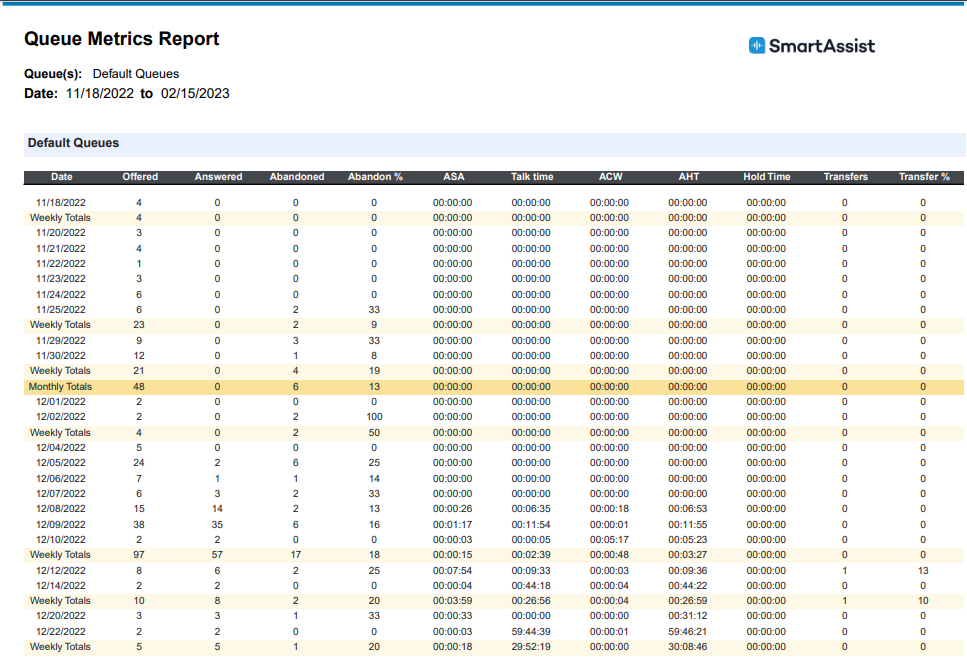
About Report Fields
| Field | Description | Example | Weekly Summary | Monthly Summary |
|---|---|---|---|---|
| Date | Date for which metrics are being consolidated. | “01/31/2023” | Not Applicable (NA) | Not Applicable (NA) |
| Offered | All conversations that entered this queue. | NNN (2) | SUM | SUM |
| Answered | All conversations that were accepted by agents to this queue. | NNN (2) | SUM | SUM |
| Abandoned | All conversations that were abandoned by callers while in this queue or with agents. | NNN (1) | SUM | SUM |
| Abandon % | Number abandoned / Number offered x 100. | NNN (50) | SUM | SUM |
| ASA | Average Speed to Answer – average wait time in a queue. | “NN:NN:NN” (00:00:11) | SUM | SUM |
| Talk time | Average Talk time – time agents in this queue spent interacting with the end user. | “NN:NN:NN” (00:00:11) | SUM | SUM |
| ACW | The average duration of After Contact Work that each agent performed for calls on this queue. | “NN:NN:NN” (00:00:11) | SUM | SUM |
| AHT | The Average Handle Time that each agent performed for calls on this queue. | “NN:NN:NN” (00:00:11) | SUM | SUM |
| Hold time | The average Hold time for all calls while in this queue. | “NN:NN:NN” (00:00:11) | SUM | SUM |
| Transfers | The number of conversations transferred from this queue. | NNN (50) | SUM | SUM |
| Transfer % | Number Transferred / Number Offered x 100. | NN (6) | SUM | SUM |