GETTING STARTED
Introduction to SmartAssist
Glossary
Minimum System and Browser Requirements
SmartAssist Lifecycle Management
SmartAssist Setup Guide
Sign Up for SmartAssist
Setup SmartAssist for Use With AgentAssist
Release Notes
Recent Updates
Previous Versions
Frequently Asked Questions (FAQ)

EXPERIENCE DESIGNERS
Flow Designer
Introduction
Create Experience Flows
Navigate the Flow Designer
Experience Flow Nodes
Introduction
Node Types
Start
IVR Menu
IVR Digit Input
Conversational Input
Split
Check Agent Availability
Check Business Hours
Message Prompt
Run Automation
Agent Transfer
Connect to API
Go to Flow
Deflect to Chat
Script Task
Set Queue
End Flow
Waiting Experience
Conversation Automation
Testing Widget
Use Cases
Overview
Questions & Answers
Conversations

ADMINISTRATORS
Account Management
Switch Account
Invite Developers to an Account
Routing
Skills
Skill Groups
Queues
Hours of Operation
Default Flows
User Management
Users
Agent Groups
Agent Settings
Role Management
Agent Status
System Setup
Channels
Voice
Chat
Email
Limitations With Accounts Using AudioCodes
Agent Transfer
Surveys
Agent Forms
Dispositions
Language & Speech
Overview
Language Management
Voice Preferences
Hold Audio
Standard Responses
Widgets
Utils
AgentAssist Settings
SearchAssist
Widget Theming (Layout Customization)
Advanced Settings
Co-Browse Settings
Community WFM (Beta)
Automatic Conversation Summary (Beta)
Intelligent Agent Tools
Reject Calls With a Delayed First Response
API Reference
API Setup
API List
Integrations
Genesys Voice Bot
Genesys + Kore Voice Automation - Manual Installation Guide
Voice Automation - Integration with Amazon Connect
Voice Automation NiceCX (CX One) - SIP Integration
Talkdesk Voice Automation
Kore Voice Automation (IVA) Integration with Zoom Contact Center (CC)
ID R&D Integration With Kore
Audit Report

AGENTS
Agent Console
Introduction
Conversation Tray
Incoming Interactions
Interacting with Customers
Additional Tools
My Dashboard

SUPERVISORS
Dashboard
Automation
Queues and Agents
Interactions
Monitor Queues, Agents, Interactions, and Service Levels
Manage Layout

BUSINESS USERS
Reports
Introduction
Reports List

AgentAssist – Current Day Statistics

The TODAY Dashboard displays graphs, counters, summary data, key statistics, and agent/conversation analytics data for call, chat, and email interactions that happened during the selection time range on the current day. The performance of an agent can be determined using metrics like:

  • The duration of an active conversation.
  • Idle conversations
  • How many conversations were recently closed by an agent.
  • How many conversations with an agent were abandoned by the customer.
  • The customer waiting queue size for an agent.
  • The agent skills that have the highest and lowest demands, and more.

The important agent performance metrics available for the current day include:

Active Conversations

This is the first panel and reflects the real-time stats related to active or ongoing conversations with customers for an agent.

Recently Closed

This panel reflects the real-time stats for recently closed customer conversations of an agent.

Idle Conversations

This panel displays real-time stats for Idle conversations where customers did not respond or continue the conversation with the agent after a conversation was initiated.

Abandoned Conversations

This panel displays the stats for abandoned conversations where customers abandoned or closed the conversation with an agent midway.

Chat Deflection and Callback Option

AgentAssist supports a chat deflection facility to route a customer during an active conversation, or after a conversation is closed, from a waiting queue to an alternative interactive channel. The system automatically routes the customer from a call to the chat channel, or from an automation call/chat channel to a live agent.

This panel displays the counts for the total chat deflections that happened for an agent. Here, you will also find the total number of callback requests made by the customers waiting in the service queue.

Queue Size

This panel displays a spike chart with high and low indicators for the queue size statistics. The queue information reflects the waiting queue experience of customers during a voice call or chat with an agent.

The metrics displayed include the total queue size. Within the given queue size graph the count for voice calls and chat queue sizes are displayed for an agent. A color legend distinguishes voice and chat conversations (red color for Voice calls and blue for chats).

Average Queue Wait Time
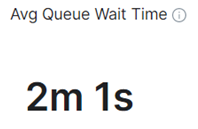
This metric represents the average queue wait time of a customer handled by an agent. This information helps monitor the efficiency and productivity of agents. The Average Queue Wait time metric helps improve agent performance and reduce the waiting time.

Count of Users in Queue/Active Conversations

Managers can view the number of users in the waiting queue or participating in active conversations. This panel helps measure agent productivity and the quality of service in addition to the following:

  • When the count of users in the waiting queue is higher than that of active conversations, it means that service is slow, waiting time is more, and agent-wise customer engagement is low.
  • When the count of users in the Active Conversations is higher than that in the queue, it indicates good customer service.

This panel displays horizontal bar graphs to represent real-time comparison data. Skill-wise data is also displayed where an overview of the commonly required agent skills for active/idle conversations is available.

You can view a combined summary graph or individual graphs for chat, email, and voice call.

Skills on Demand

As a manager, you would want to view which agent skills are in demand based on the analytics information available for email, chat, and call.

AgentAssist automatically fetches this key data to internally evaluate and rank different agent skills based on customer experience and demand. The same is reflected in the Skills on Demand panel in the form of bubble graph.

The skill with the highest customer demand and activity is represented by the biggest bubble, the skill next in line is represented by a smaller bubble, and so on.
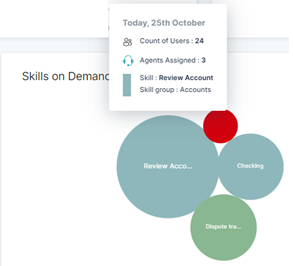
Hovering over a bubble displays the following skills metadata:

  • Count of Users – Who contact agents with this skill.
  • Agents Assigned – Agents with this skill assigned to users.
  • Skill – The name of the skill.
  • Skill Group – The parent group to which this skill is mapped.

Average First Response in Chat

First responses are key to building exceptional customer experiences on any Customer Support platform. This key metric represents agent-wise average first responses as horizontal bar graphs.
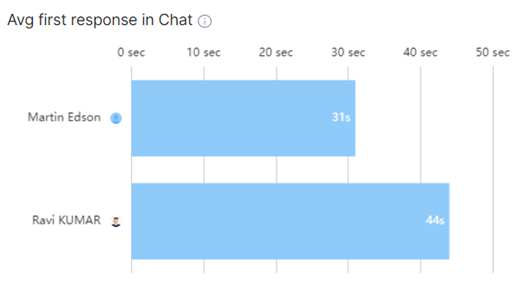
The Avg. First Response in the Chat panel indicates the average time an agent takes to provide the first response to a customer query over chat.

The shorter the response time, the better the customer experience. A lower average first response means lesser chat abandons by customers.

Overall Performance of Chat Agents
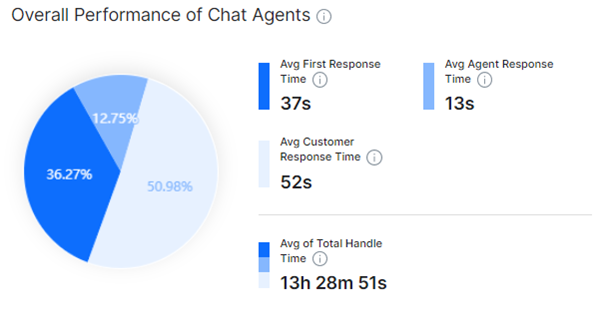
The performance of a chat agent can be measured using the overall handle time.

This panel provides actionable insights (percentage data) on three primary factors:

  • First Response Time- The time taken by an agent to initiate a chat conversation with the customer once the chat request is triggered.
  • Agent Response Time- The time taken by an agent to respond to a query or conversation with the customer during an ongoing chat session.
  • Customer Response Time- The time taken by an agent to respond to a query or conversation with the customer during an ongoing chat session.

The Total handle time provides the cumulative time taken by all the chat agents to handle customer chats. The Avg. of total handle time is the sum of the total handle time divided by the total number of agents.

The lower this value, the better the performance of the agents in the selected agent group.

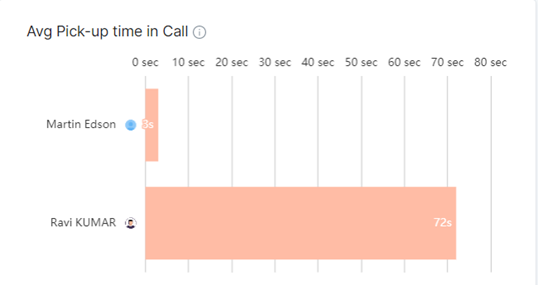
Avg. Pickup Time in Call

This panel displays a horizontal bar graph representing the agent-wise average time to pick up a customer call. This metric helps determine if the average pick up time is more and also helps improve CX by assigning the task to a faster agent. The time range for this graph is 0 seconds to 80 seconds.
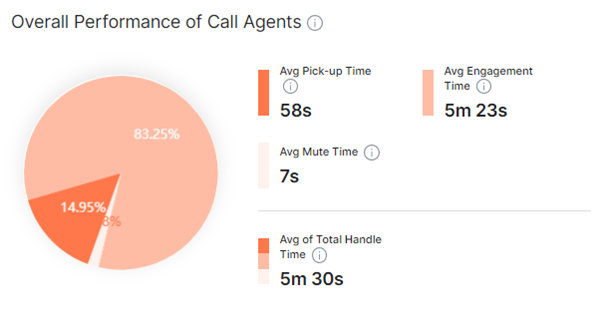
Overall Performance of Call Agents

This displays the pie chart for the following:

  • Pick up time: The average pick up time of a customer call.
  • Engagement time: The average time spent by agents in engaging with a customer.
  • Mute time: The average time an agent places the customer call on mute.
  • of Total Handle Time: The average of the Avg. Pick up time+ Avg. Engagement time+ Avg. Mute time of all the agents.

Each metric is marked with a legend (indicated by a unique color) that differentiates the relevant data in the pie chart depiction.

A higher Avg. Engagement time, lower Avg. pick up time, and Avg. Mute time % values represented on the pie chart indicate very good overall agent performance, and vice-versa.
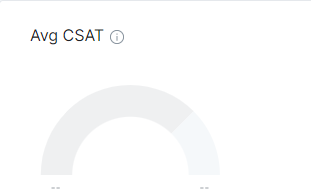
Avg. CSAT

This panel displays the meter or gauge chart that represents the average of all the customer satisfaction scores for a specific agent. The lower and higher scores are marked using different colors.
CSAT by Channel/Agent

This panel displays the clustered bar graph or a multi-set bar chart for the channel or agent-wise CSAT scores. Different channels or agents are depicted in different colors. A legend is displayed for reference.

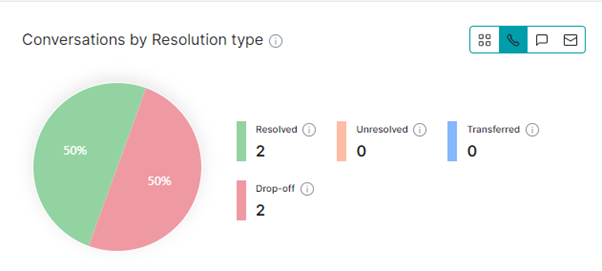
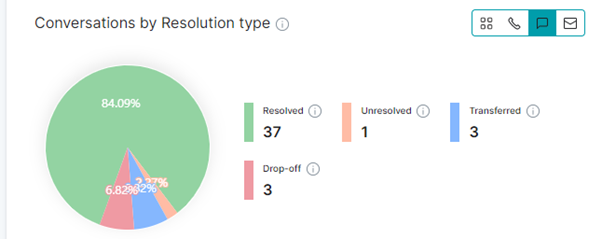
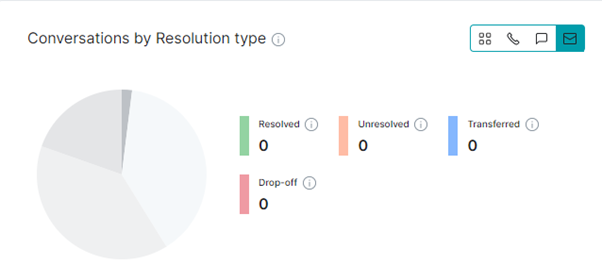
Conversations by Resolution Type

This panel displays the percentage pie chart representing the conversation resolution statuses for a specific channel or all the channels (email, chat, and call).

The statuses captured in the chart include:

  • Resolved: Customer query has been resolved by the agent.
  • Unresolved: Customer query has not been resolved by the agent.
  • Transferred: Conversations transferred to another channel/agent.
  • Drop-off: Conversations dropped by customers.

The counts of these statuses are displayed along with the color legend.

All Channels

Call Channel
Chat Channel
Email Channel
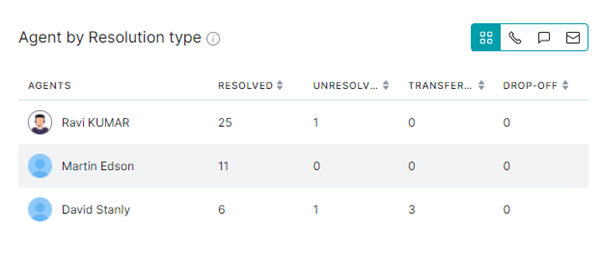
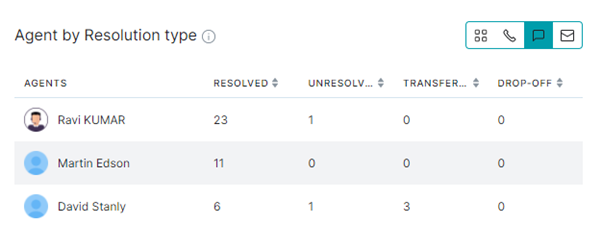
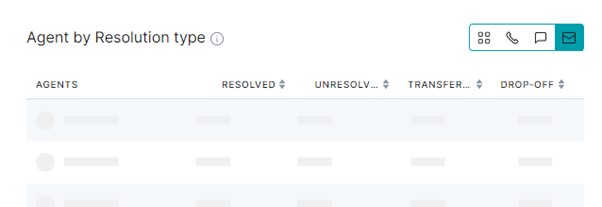
Agent by Resolution Type

This panel displays the agent-wise counts based on the channel(s) you select (tap the icon to select) for the following final conversation statuses:

  • Resolved
  • Unresolved
  • Transferred
  • Drop-off

All Channels

Call Channel

Chat Channel
Email Channel
[/vc_column_text][/vc_column][/vc_row]

AgentAssist – Current Day Statistics

The TODAY Dashboard displays graphs, counters, summary data, key statistics, and agent/conversation analytics data for call, chat, and email interactions that happened during the selection time range on the current day. The performance of an agent can be determined using metrics like:

  • The duration of an active conversation.
  • Idle conversations
  • How many conversations were recently closed by an agent.
  • How many conversations with an agent were abandoned by the customer.
  • The customer waiting queue size for an agent.
  • The agent skills that have the highest and lowest demands, and more.

The important agent performance metrics available for the current day include:

Active Conversations

This is the first panel and reflects the real-time stats related to active or ongoing conversations with customers for an agent.

Recently Closed

This panel reflects the real-time stats for recently closed customer conversations of an agent.

Idle Conversations

This panel displays real-time stats for Idle conversations where customers did not respond or continue the conversation with the agent after a conversation was initiated.

Abandoned Conversations

This panel displays the stats for abandoned conversations where customers abandoned or closed the conversation with an agent midway.

Chat Deflection and Callback Option

AgentAssist supports a chat deflection facility to route a customer during an active conversation, or after a conversation is closed, from a waiting queue to an alternative interactive channel. The system automatically routes the customer from a call to the chat channel, or from an automation call/chat channel to a live agent.

This panel displays the counts for the total chat deflections that happened for an agent. Here, you will also find the total number of callback requests made by the customers waiting in the service queue.

Queue Size

This panel displays a spike chart with high and low indicators for the queue size statistics. The queue information reflects the waiting queue experience of customers during a voice call or chat with an agent.

The metrics displayed include the total queue size. Within the given queue size graph the count for voice calls and chat queue sizes are displayed for an agent. A color legend distinguishes voice and chat conversations (red color for Voice calls and blue for chats).

Average Queue Wait Time

This metric represents the average queue wait time of a customer handled by an agent. This information helps monitor the efficiency and productivity of agents. The Average Queue Wait time metric helps improve agent performance and reduce the waiting time.

Count of Users in Queue/Active Conversations

Managers can view the number of users in the waiting queue or participating in active conversations. This panel helps measure agent productivity and the quality of service in addition to the following:

  • When the count of users in the waiting queue is higher than that of active conversations, it means that service is slow, waiting time is more, and agent-wise customer engagement is low.
  • When the count of users in the Active Conversations is higher than that in the queue, it indicates good customer service.

This panel displays horizontal bar graphs to represent real-time comparison data. Skill-wise data is also displayed where an overview of the commonly required agent skills for active/idle conversations is available.

You can view a combined summary graph or individual graphs for chat, email, and voice call.

Skills on Demand

As a manager, you would want to view which agent skills are in demand based on the analytics information available for email, chat, and call.

AgentAssist automatically fetches this key data to internally evaluate and rank different agent skills based on customer experience and demand. The same is reflected in the Skills on Demand panel in the form of bubble graph.

The skill with the highest customer demand and activity is represented by the biggest bubble, the skill next in line is represented by a smaller bubble, and so on.

Hovering over a bubble displays the following skills metadata:

  • Count of Users – Who contact agents with this skill.
  • Agents Assigned – Agents with this skill assigned to users.
  • Skill – The name of the skill.
  • Skill Group – The parent group to which this skill is mapped.

Average First Response in Chat

First responses are key to building exceptional customer experiences on any Customer Support platform. This key metric represents agent-wise average first responses as horizontal bar graphs.

The Avg. First Response in the Chat panel indicates the average time an agent takes to provide the first response to a customer query over chat.

The shorter the response time, the better the customer experience. A lower average first response means lesser chat abandons by customers.

Overall Performance of Chat Agents

The performance of a chat agent can be measured using the overall handle time.

This panel provides actionable insights (percentage data) on three primary factors:

  • First Response Time- The time taken by an agent to initiate a chat conversation with the customer once the chat request is triggered.
  • Agent Response Time- The time taken by an agent to respond to a query or conversation with the customer during an ongoing chat session.
  • Customer Response Time- The time taken by an agent to respond to a query or conversation with the customer during an ongoing chat session.

The Total handle time provides the cumulative time taken by all the chat agents to handle customer chats. The Avg. of total handle time is the sum of the total handle time divided by the total number of agents.

The lower this value, the better the performance of the agents in the selected agent group.

Avg. Pickup Time in Call

This panel displays a horizontal bar graph representing the agent-wise average time to pick up a customer call. This metric helps determine if the average pick up time is more and also helps improve CX by assigning the task to a faster agent. The time range for this graph is 0 seconds to 80 seconds.

Overall Performance of Call Agents

This displays the pie chart for the following:

  • Pick up time: The average pick up time of a customer call.
  • Engagement time: The average time spent by agents in engaging with a customer.
  • Mute time: The average time an agent places the customer call on mute.
  • of Total Handle Time: The average of the Avg. Pick up time+ Avg. Engagement time+ Avg. Mute time of all the agents.

Each metric is marked with a legend (indicated by a unique color) that differentiates the relevant data in the pie chart depiction.

A higher Avg. Engagement time, lower Avg. pick up time, and Avg. Mute time % values represented on the pie chart indicate very good overall agent performance, and vice-versa.

Avg. CSAT

This panel displays the meter or gauge chart that represents the average of all the customer satisfaction scores for a specific agent. The lower and higher scores are marked using different colors.

CSAT by Channel/Agent

This panel displays the clustered bar graph or a multi-set bar chart for the channel or agent-wise CSAT scores. Different channels or agents are depicted in different colors. A legend is displayed for reference.

Conversations by Resolution Type

This panel displays the percentage pie chart representing the conversation resolution statuses for a specific channel or all the channels (email, chat, and call).

The statuses captured in the chart include:

  • Resolved: Customer query has been resolved by the agent.
  • Unresolved: Customer query has not been resolved by the agent.
  • Transferred: Conversations transferred to another channel/agent.
  • Drop-off: Conversations dropped by customers.

The counts of these statuses are displayed along with the color legend.

All Channels

Call Channel

Chat Channel

Email Channel

Agent by Resolution Type

This panel displays the agent-wise counts based on the channel(s) you select (tap the icon to select) for the following final conversation statuses:

  • Resolved
  • Unresolved
  • Transferred
  • Drop-off

All Channels

Call Channel

Chat Channel

Email Channel

[/vc_column_text][/vc_column][/vc_row]