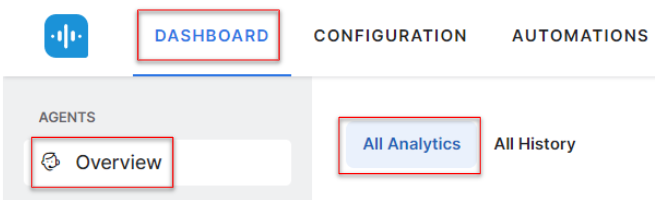
The All Analytics tab helps analyze the KPIs of Agent Group or Agents for the selected time period. Go to DASHBOARD > AGENTS > Overview > All analytics section.
The Dashboard displays data for the selected time frame across the call, chat, and email channels. You can also explicitly select a date and time range of other days to view data. The following metrics are covered in this section:
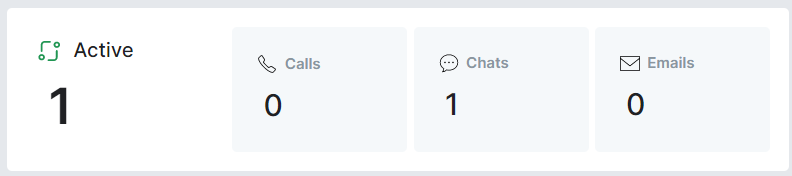
- Active – Displays the number of active or ongoing conversations with customers for an agent.
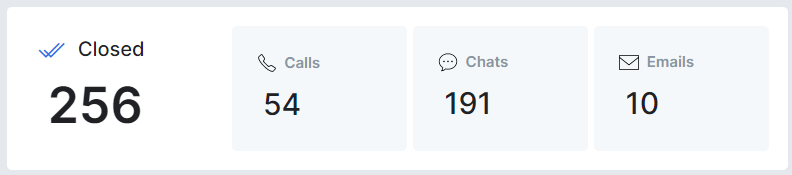
- Closed – Displays the number of closed customer conversations of an agent.
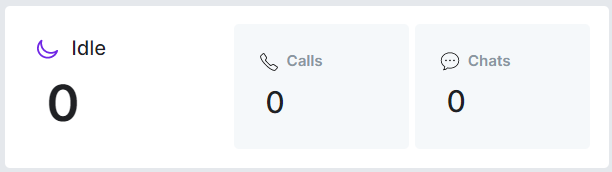
- Idle – Displays the number of Idle conversations where customers did not respond or did not continue the conversation with an agent after initiating a conversation.
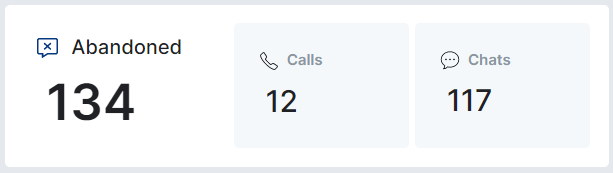
- Abandoned – Displays the stats for abandoned conversations where customers abandoned or closed the conversation with an agent midway.
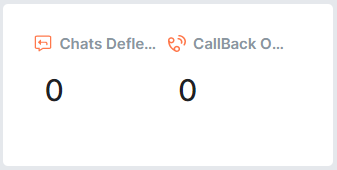
- Chats Deflection and CallBack Option – Displays the count of chats deflected and callback options.
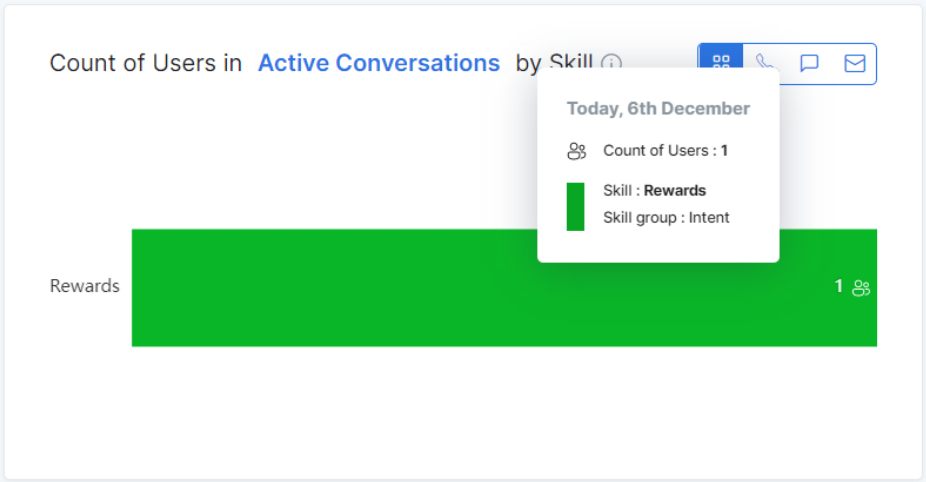
- Count of Users in Active Conversations by Skill – Managers can see an overview of the most common skills used in active conversations, idle conversations, or both. You can view a combined summary or individual graphs for voice calls, chats, and emails.
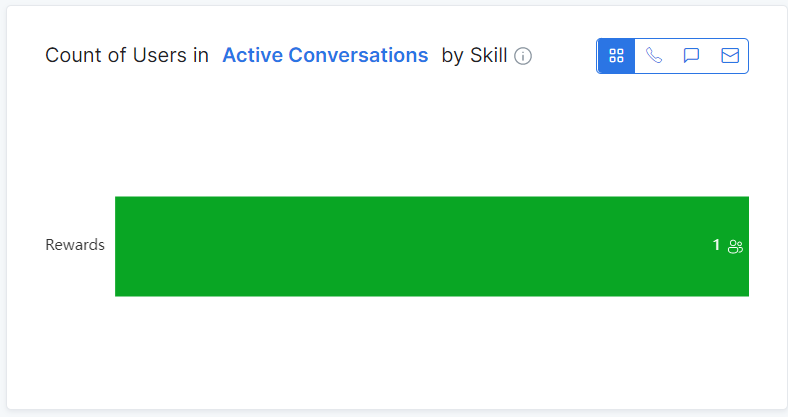
Hover over the band to view the date, Count of Users, Skill, and Skill group.
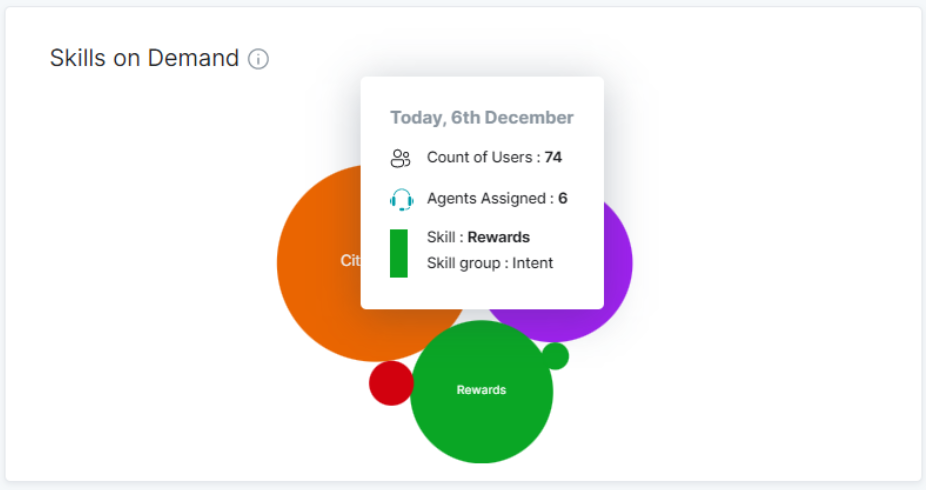
- Skills on Demand – Each bubble represents an activity. The bubble sizes show demand for specific skills.
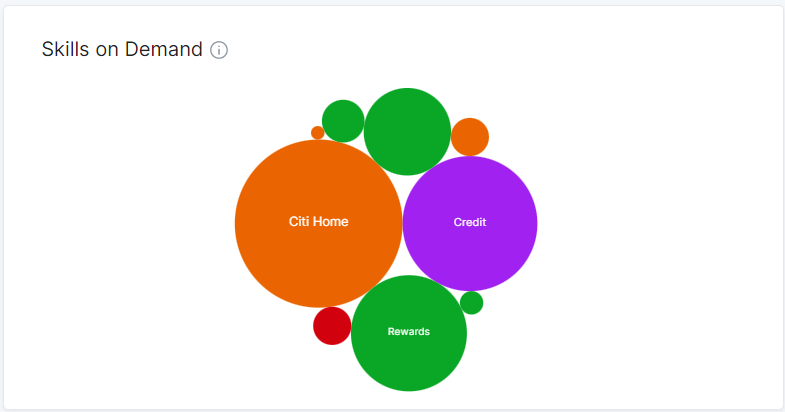
Hover over the bubbles to view the date, Count of Users, Skill, and Skill group.
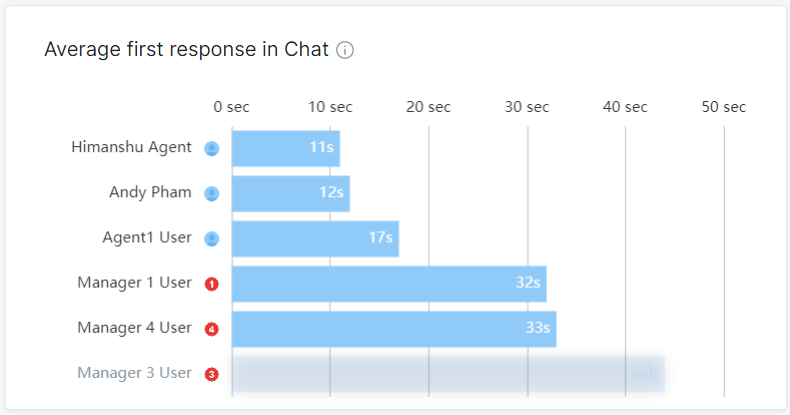
- Average First Response in Chat – The Average First Response in the Chat panel indicates the average time an agent takes to provide the first response to a customer query over chat.
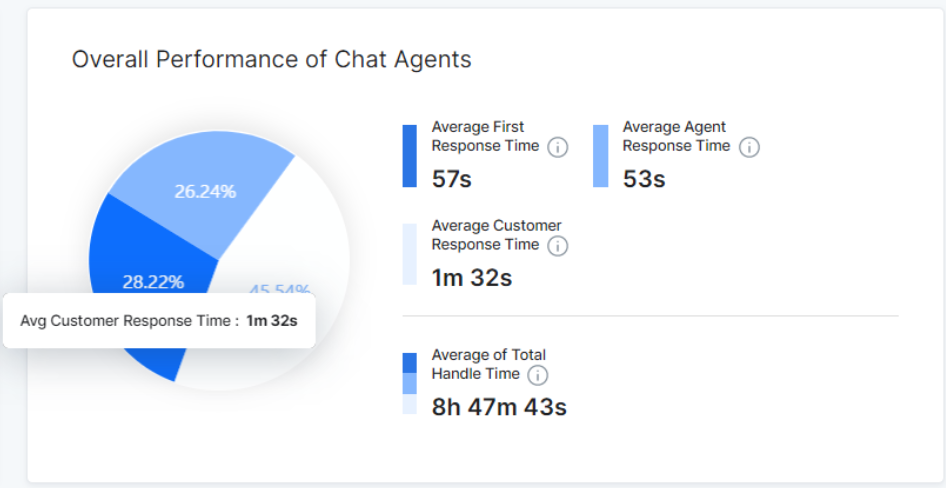
- Overall Performance of Chat Agents – The performance of a chat agent can be measured using the overall handle time. The following metrics are displayed:
- Average First Response Time: The average time an agent takes to respond to the customer chat.
- Average Agent Response Time: The average time an agent takes to respond to the customer over the total duration of the chat.
- Average Customer Response Time: The average time a customer takes to respond to an agent.
- Average of Total Handle Time: The average of the “Average First Response Time + Average Agent Response Time + Average Customer Response Time” of all the agents.
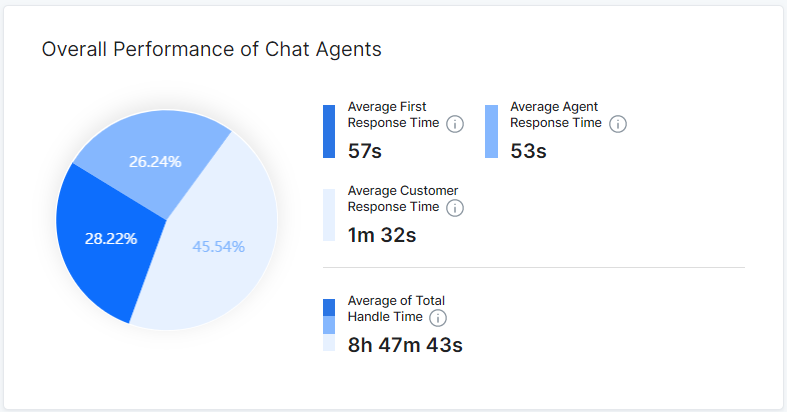
Hover over each section to view the related details.
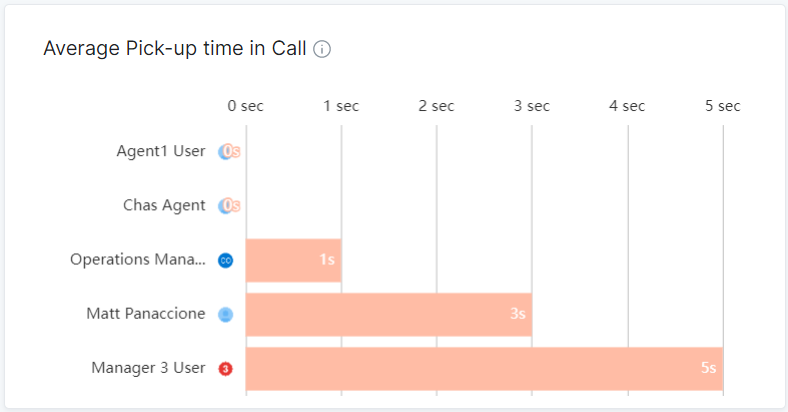
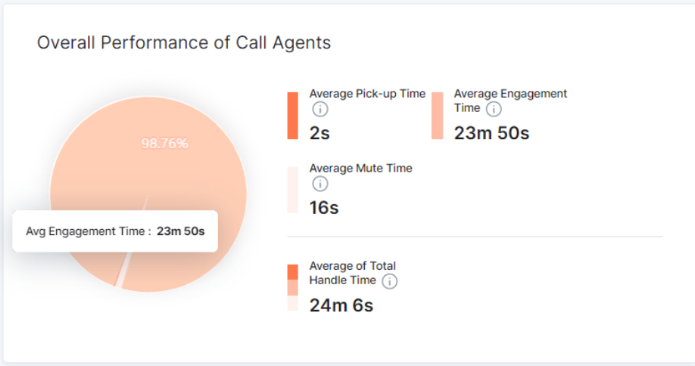
- Average Pickup Time in Call – The average time to respond to a customer call once it lands in an agent queue.
- Overall Performance of Call Agents: It displays the following metrics:
-
- Average Pick-up Time: The average pick-up time of a customer call.
- Average Engagement Time: The average time agents spend engaging with a customer.
- Average Mute Time: The average time an agent places the customer call on mute.
- Average of Total Handle Time: The average of the “Average Pick Up Time + Average Engagement Time + Average Mute Time” of all the agents.
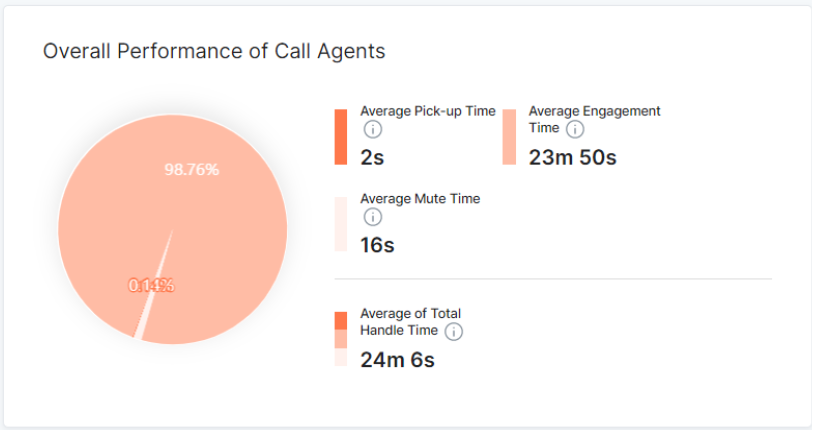
Hover over each section to view the related details.
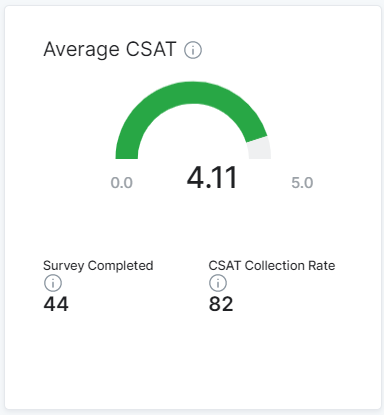
- Average CSAT – Average customer satisfaction scores for a specific agent. This section also displays the count of Survey Completed and CSAT Collection Rate.
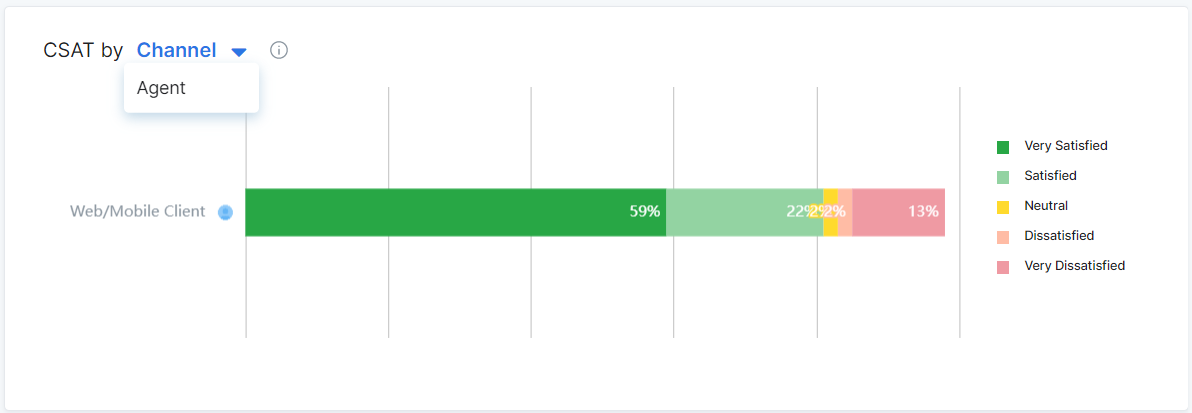
- CSAT by Channel or Agent – Customer satisfaction scores by channel or agents. Hover over each section of the graph to view related details.
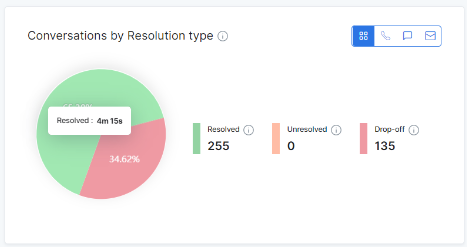
- Conversations by Resolution Type – Count of conversations split by status – Resolved, Unresolved, Transferred, or Drop-off. You can view a combined summary or individual graphs for calls, chats, and emails.
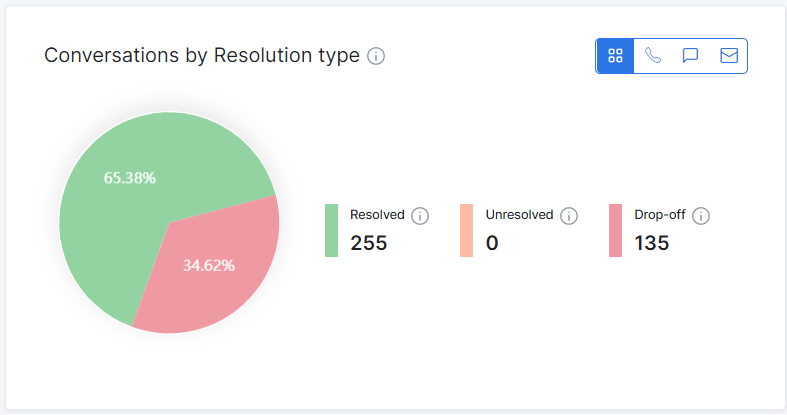
Hover over each section to view the related details.
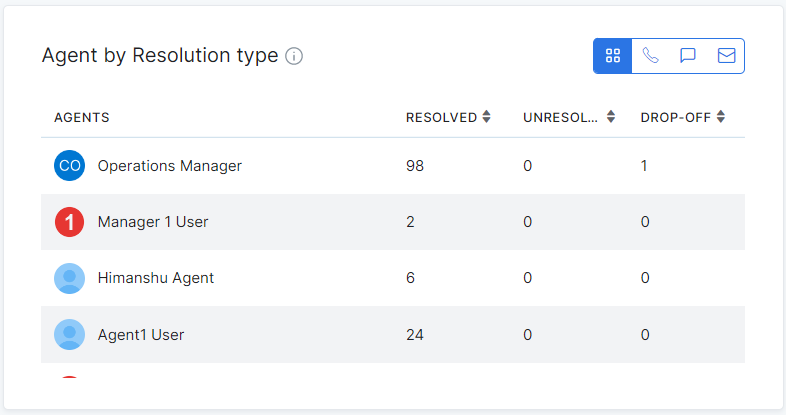
- Agent by Resolution Type – Count of conversations split by agent and status – Resolved, Unresolved, Transferred, or Drop-off. You can view a combined summary or individual graphs for calls, chats, and emails.