
Generating the Latency Report
The Latency Report highlights calls exceeding a defined latency threshold. For example, supervisors can generate a report of all calls where the P90 end-to-end latency is greater than 500 milliseconds (ms).
To generate a Latency Report:
- On the Reports tab, click New Report.
- In the list of reports, choose the Latency Report.
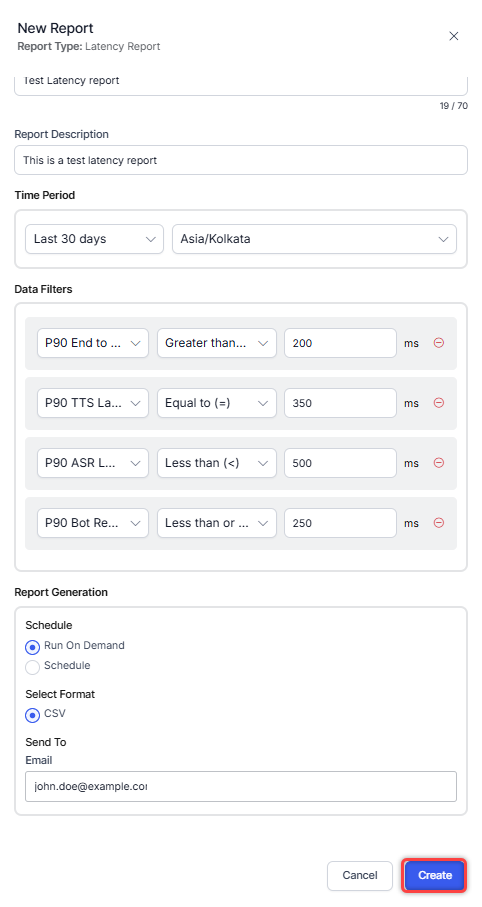
- Enter the Report Name and Report Description.
- Select a Time Period.
- Select Data Filters from the following.
P90 Values Condition Threshold Values (ms) P90 End-to-End Latency
P90 ASR Latency
P90 Bot Response Time
P90 TTS LatencyGreater than or equal to (≥)
Less than or equal to (≤)
Greater than (>)
Less than (<)
Equal to (=)For example, 200 ms - Select Report Generation and choose from the following options:
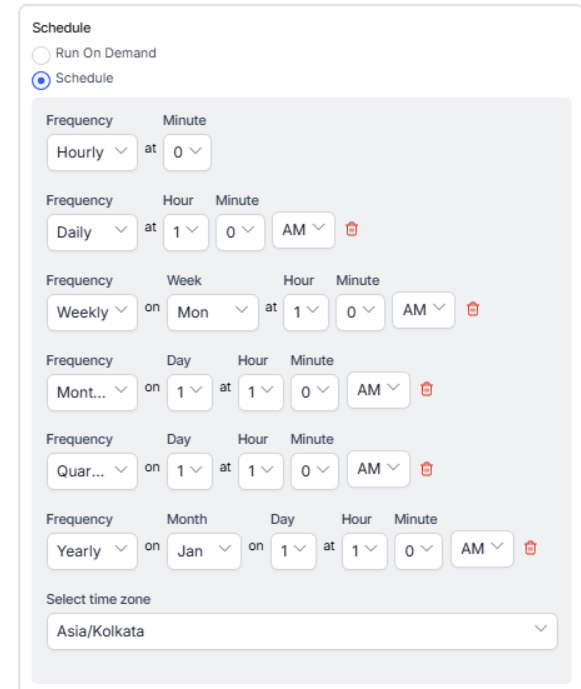
- Schedule
- Run On Demand
- Schedule
- You can create up to six schedules (only one if you select Hourly).
- Select Format
- CSV
- Send To (single email address or mailing list)
- You can create up to six schedules (only one if you select Hourly).
- Schedule
- Click Create.
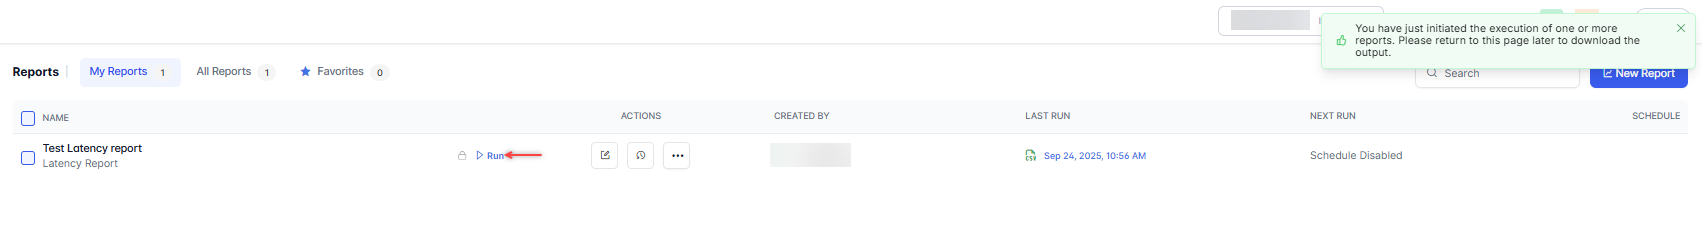
- An instance of the Latency Report is generated.

- Click the Run icon next to the report instance.
While generating reports, you have two options: Run On Demand and Schedule.
- Run On Demand: While creating a new report or editing an existing report, the schedule of the report can be set to run on demand.
- Schedule: While creating a new report or editing an existing report, the schedule of the report can be changed. The use of the schedule is the standard way to generate a report. If the report is scheduled for later, then it will automatically be generated on the scheduled day and time without the need to click Run.
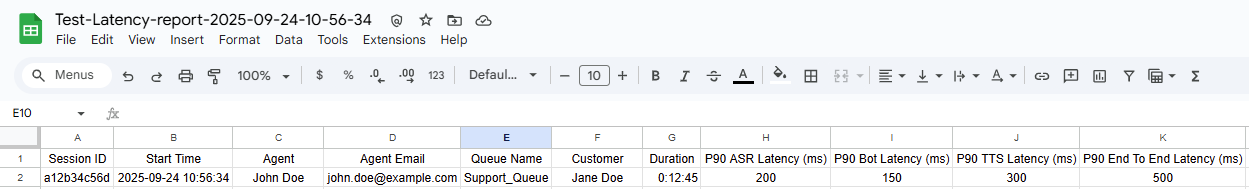
- Click the CSV icon and generate the output of that report, as shown below.

- The Latency Report is generated.
About Report Fields
| Field | Description | Example |
| Session ID | Unique identifier for each interaction session. | a12b34c56d |
| Start Time | Timestamp when the session started. | 2025-09-24 10:56:34 |
| Agent | Name of the agent handling the session. | John Doe |
| Agent Email | Email address of the agent. | john.doe@example.com |
| Queue Name | Name of the queue the interaction was routed through. | Support_Queue |
| Customer | Identifier or name of the customer involved in the session. | Jane Doe |
| Duration | Total time the session lasted. | 00:12:45 |
| P90 ASR Latency (ms) | 90th percentile latency of Automatic Speech Recognition, in milliseconds. Indicates how long speech-to-text processing takes. | 250 |
| P90 Bot Latency (ms) | 90th percentile latency for the bot’s response processing, in milliseconds. Shows system responsiveness. | 120 |
| P90 TTS Latency (ms) | 90th percentile latency of Text-to-Speech processing, in milliseconds. Represents the time to convert text into audio. | 180 |
| P90 End To End Latency (ms) | 90th percentile overall latency from customer speech to agent/bot reply, in milliseconds. Combines ASR, bot, and TTS processing times. | 600 |