
Overview
Wallboards enhance the ability to oversee operations efficiently and effectively. Contact Center Administrators and Supervisors can create, edit, and delete the wallboards. Their fixed, high-resolution display ensures that users can access clear and consistent information, which is suitable for high-definition screens and full-screen viewing.
Launch Wallboard
Steps to launch the wallboard:
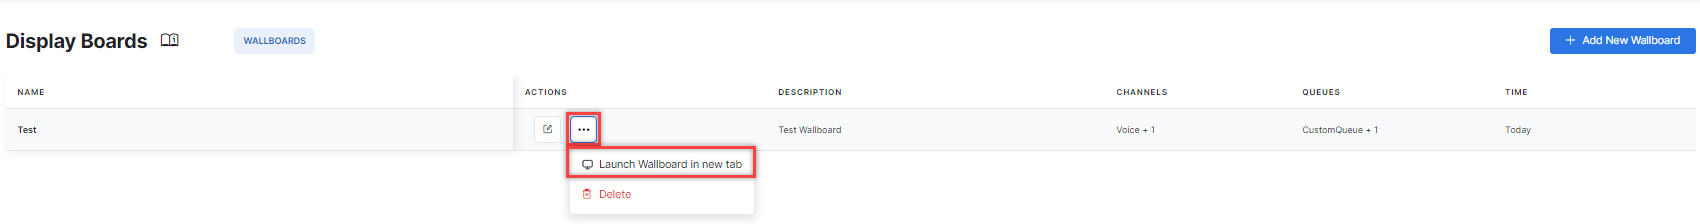
- Click the (…) icon and click Launch Wallboard in new tab. The Wallboard is displayed in a new browser tab.
You can also access wallboards by going to DASHBOARD > Wallboards.

- The data on the dashboard is refreshed after 60 seconds. The data in the live widgets refreshes every second.
Center Wide:
Queue Specific:
Wallboard Widgets
The following widgets on the wallboard show data related to the KPIs of the contact center for the configured time duration.
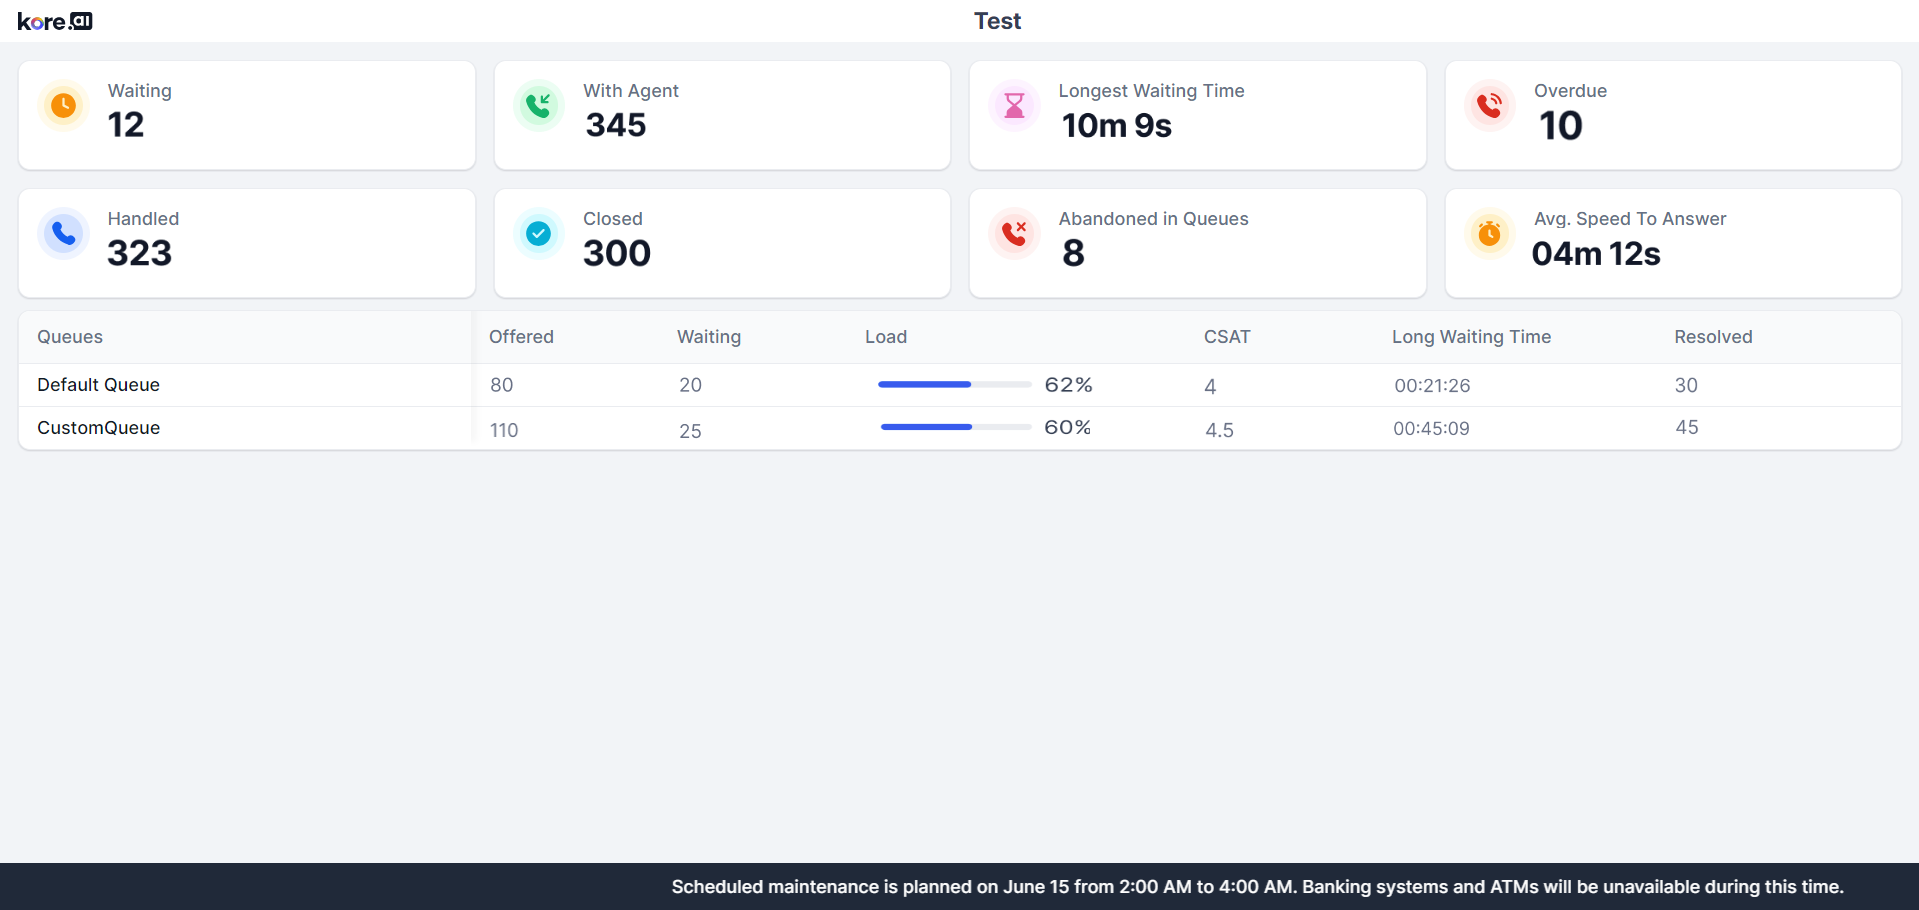
Center Wide
- The wallboard name is displayed at the top of the wallboard.
- The top section of the wallboard shows the following widgets:

| Name | Live/Time based | Description |
| Waiting | Live | Count of all conversations waiting in all queues. |
| With Agent | Live | Count of all conversations currently with Agents. |
| Longest Waiting Time | Live | Duration of the longest wait of any conversation currently in a waiting state. |
| Overdue | Live | Count of all conversations currently overdue with Agents. |
| Handled | Time-based | Count of all conversations handled (completed) by the contact center. |
| Closed | Time-based | Count of all conversations closed properly by agents at the contact center. |
| Abandoned | Time-based | Count of all conversations abandoned by users in queues. |
| Avg. Speed To Answer (ASA) | Time-based | ASA of all conversations. |
- The bottom section of the wallboard shows the following data related to the queues.

| Name | Live/Time based | Description |
| Queues | NA | Names of the configured queues. |
| Offered | Time-based | Count of all conversations offered in the queue. |
| Waiting | Live | Count of all conversations waiting in the queue. |
| Load | Live | The current load on the queue in percentage. |
| CSAT | Time-based | Average CSAT of all conversations in this queue/count of all conversations with CSAT in the queue. |
| Long Waiting Time | Live | Duration of the longest wait by any conversation currently waiting in the queue. |
| Closed | Time-based | Count of conversations closed properly in the queue. |
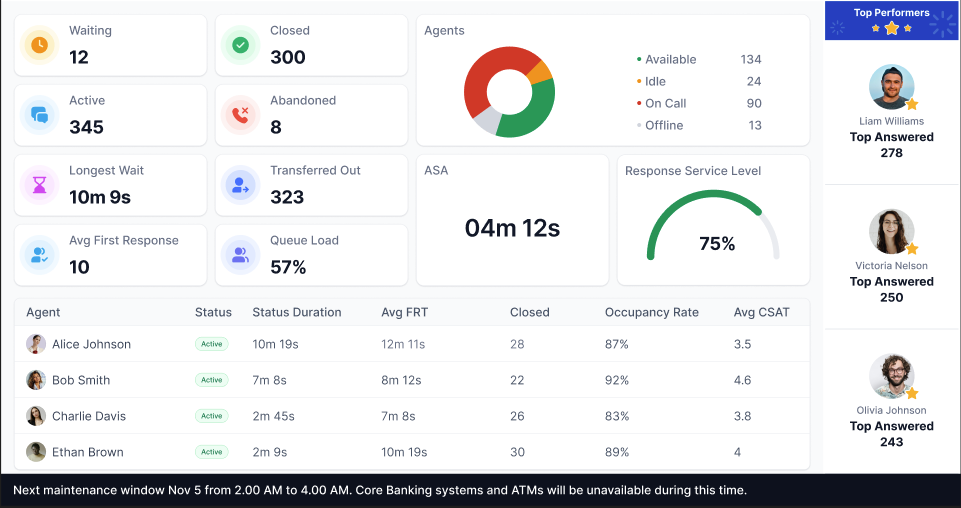
Queue Specific
- The wallboard name is displayed at the top of the wallboard.
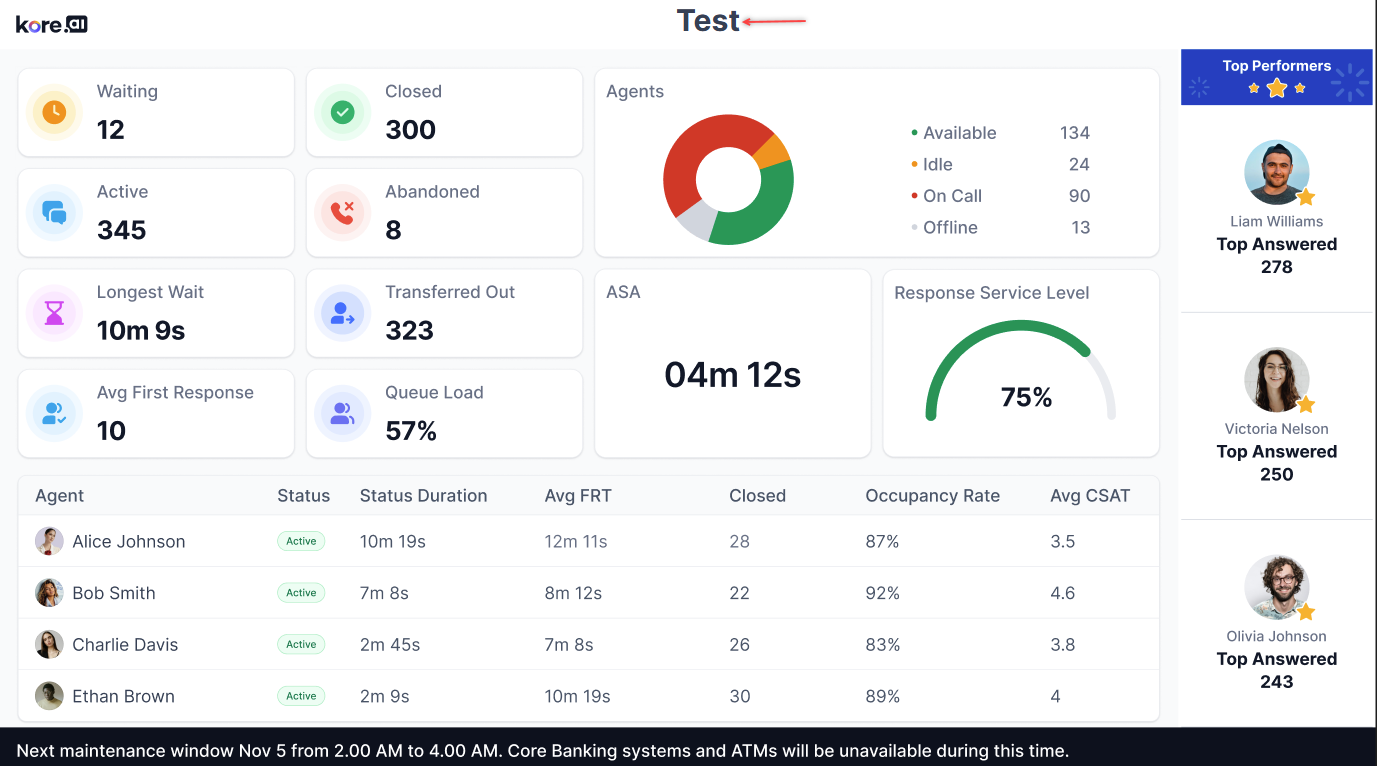
- The top section of the wallboard shows the following widgets:
Multiple Insights:

One Insight:

- The top left section of the wallboard shows the following widgets:
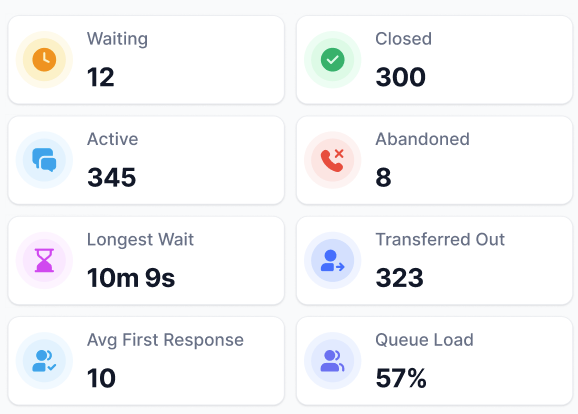
| Name | Description |
| Waiting | Number of conversations waiting in the selected queue. |
| Closed | Number of conversations properly closed by agents in the selected queue. |
| Active | Number of conversations in active conversations with agents in the selected queue. |
| Abandoned | Number of conversations abandoned in selected queue. |
| Longest Wait | Longest wait time for all conversations in the selected queue (format: NNNh NNm NNs). |
| Transferred Out | The number of conversations transferred to other queues from the selected queue. |
| Avg. First Response Time (FRT) | Average first response time for all conversations in the selected queue. |
| Queue Load Percentage | The ratio of current queue demand to the queue’s handling capacity, expressed as a percentage.
Formula: (Number of waiting conversations + Number of active conversations) / (Number of available agents * Target conversations per agent) * 100% |
- The right section of the wallboard shows the following widgets based on the selected option:

| Name | Range | Description |
| Top N Closed | N in the range of 1-3 | Shows agents with the highest number of closed conversations. |
| Top N Answered | N in the range of 1-3 | Shows agents with the highest number of accepted conversations. |
| Top N CSAT | N in the range of 1-3 | Shows agents with the highest CSAT. |
| Top N Occupancy Rate | N in the range of 1-3 | Shows agents with the highest occupancy rate. |
| Top N Average First Response Time | N in the range of 1-3 | Shows agents with the lowest Average First Response Time (FRT). |
- The bottom section of the wallboard shows the following agent-related data.
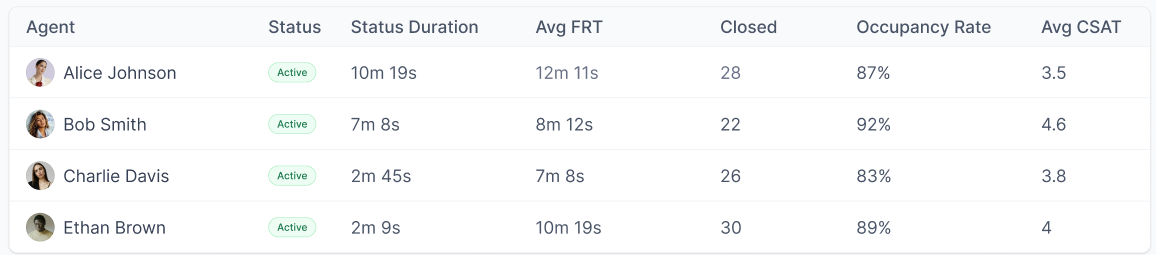
| Name | Description |
| Agent | The name and display picture of agents. |
| Status | Current status of the agent. |
| Status Duration | How long the agent has been in the current status (format: NNNh NNm NNs) |
| Avg. FRT | Average First Response Time of the agent. |
| Closed | The number of conversations properly closed by the agent. |
| Occupancy Rate | The percentage of an agent’s logged-in time that is spent actively handling conversations.
Formula: (time agent was actively working [talk + hold + snooze + mute + ACW]) * 100.0 / (time spent Logged in) |
| Avg. CSAT | Average CSAT of the agent. |
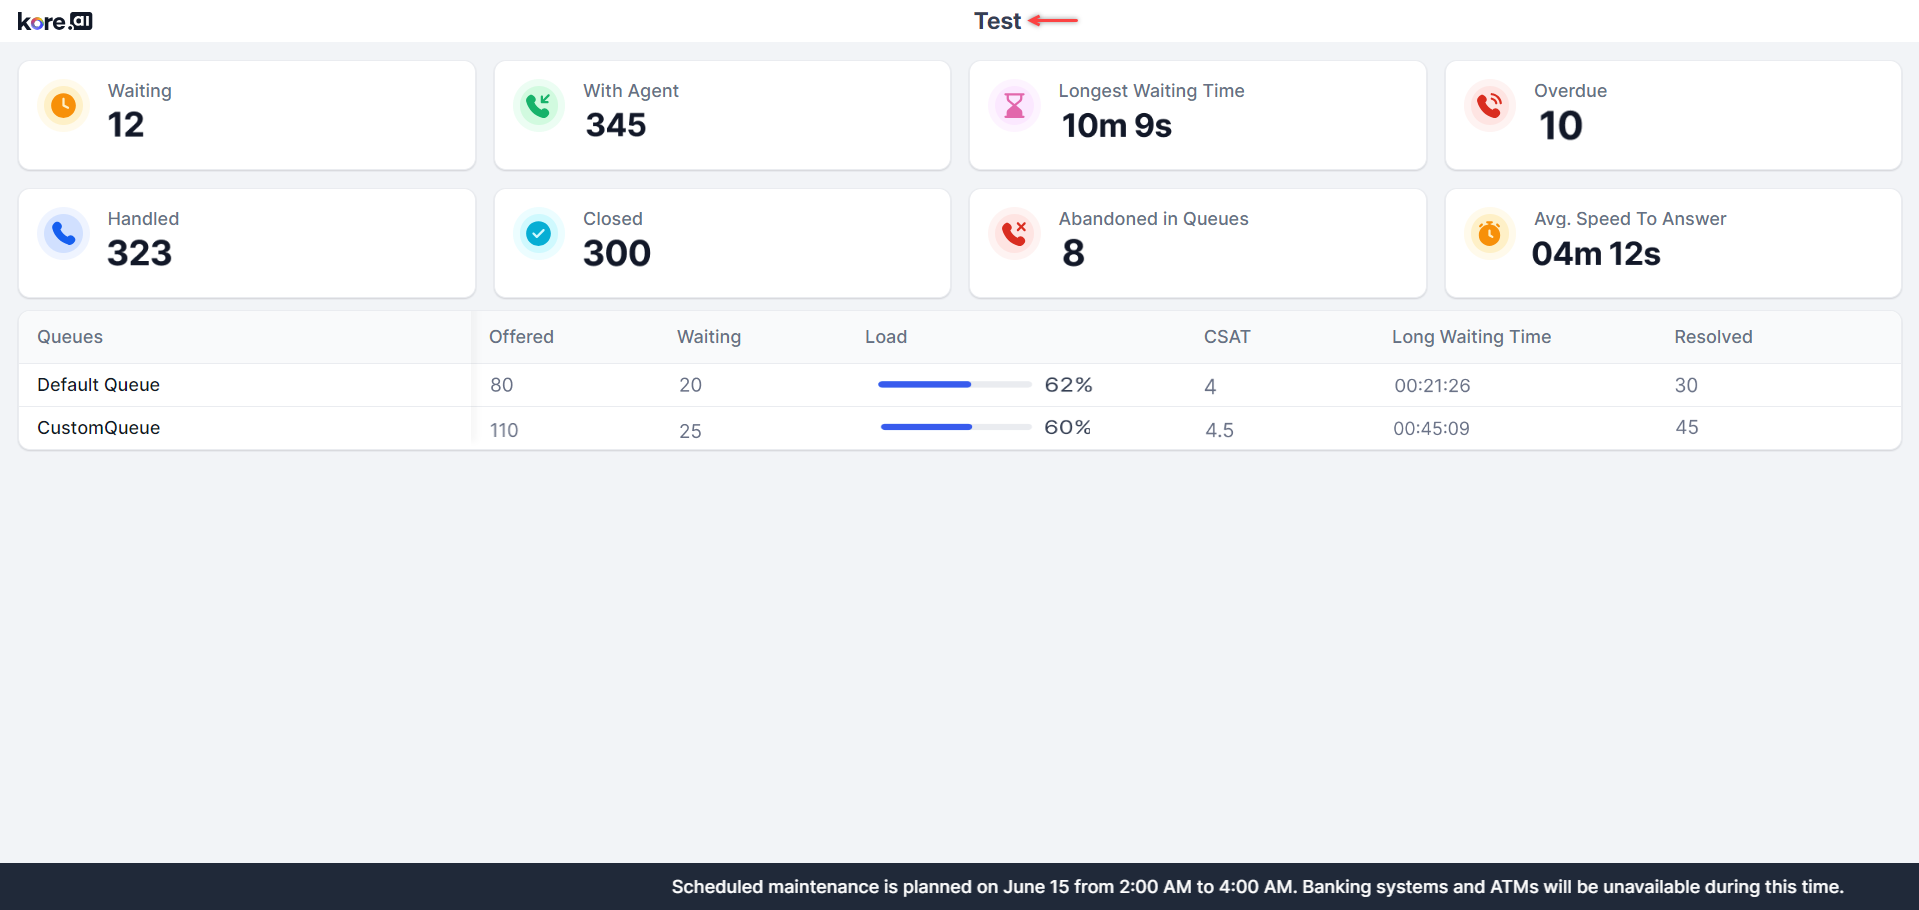
If the enable scroll text toggle is turned on while creating the wallboard, the configured text displays at the bottom of the page at the selected speed.
![]()