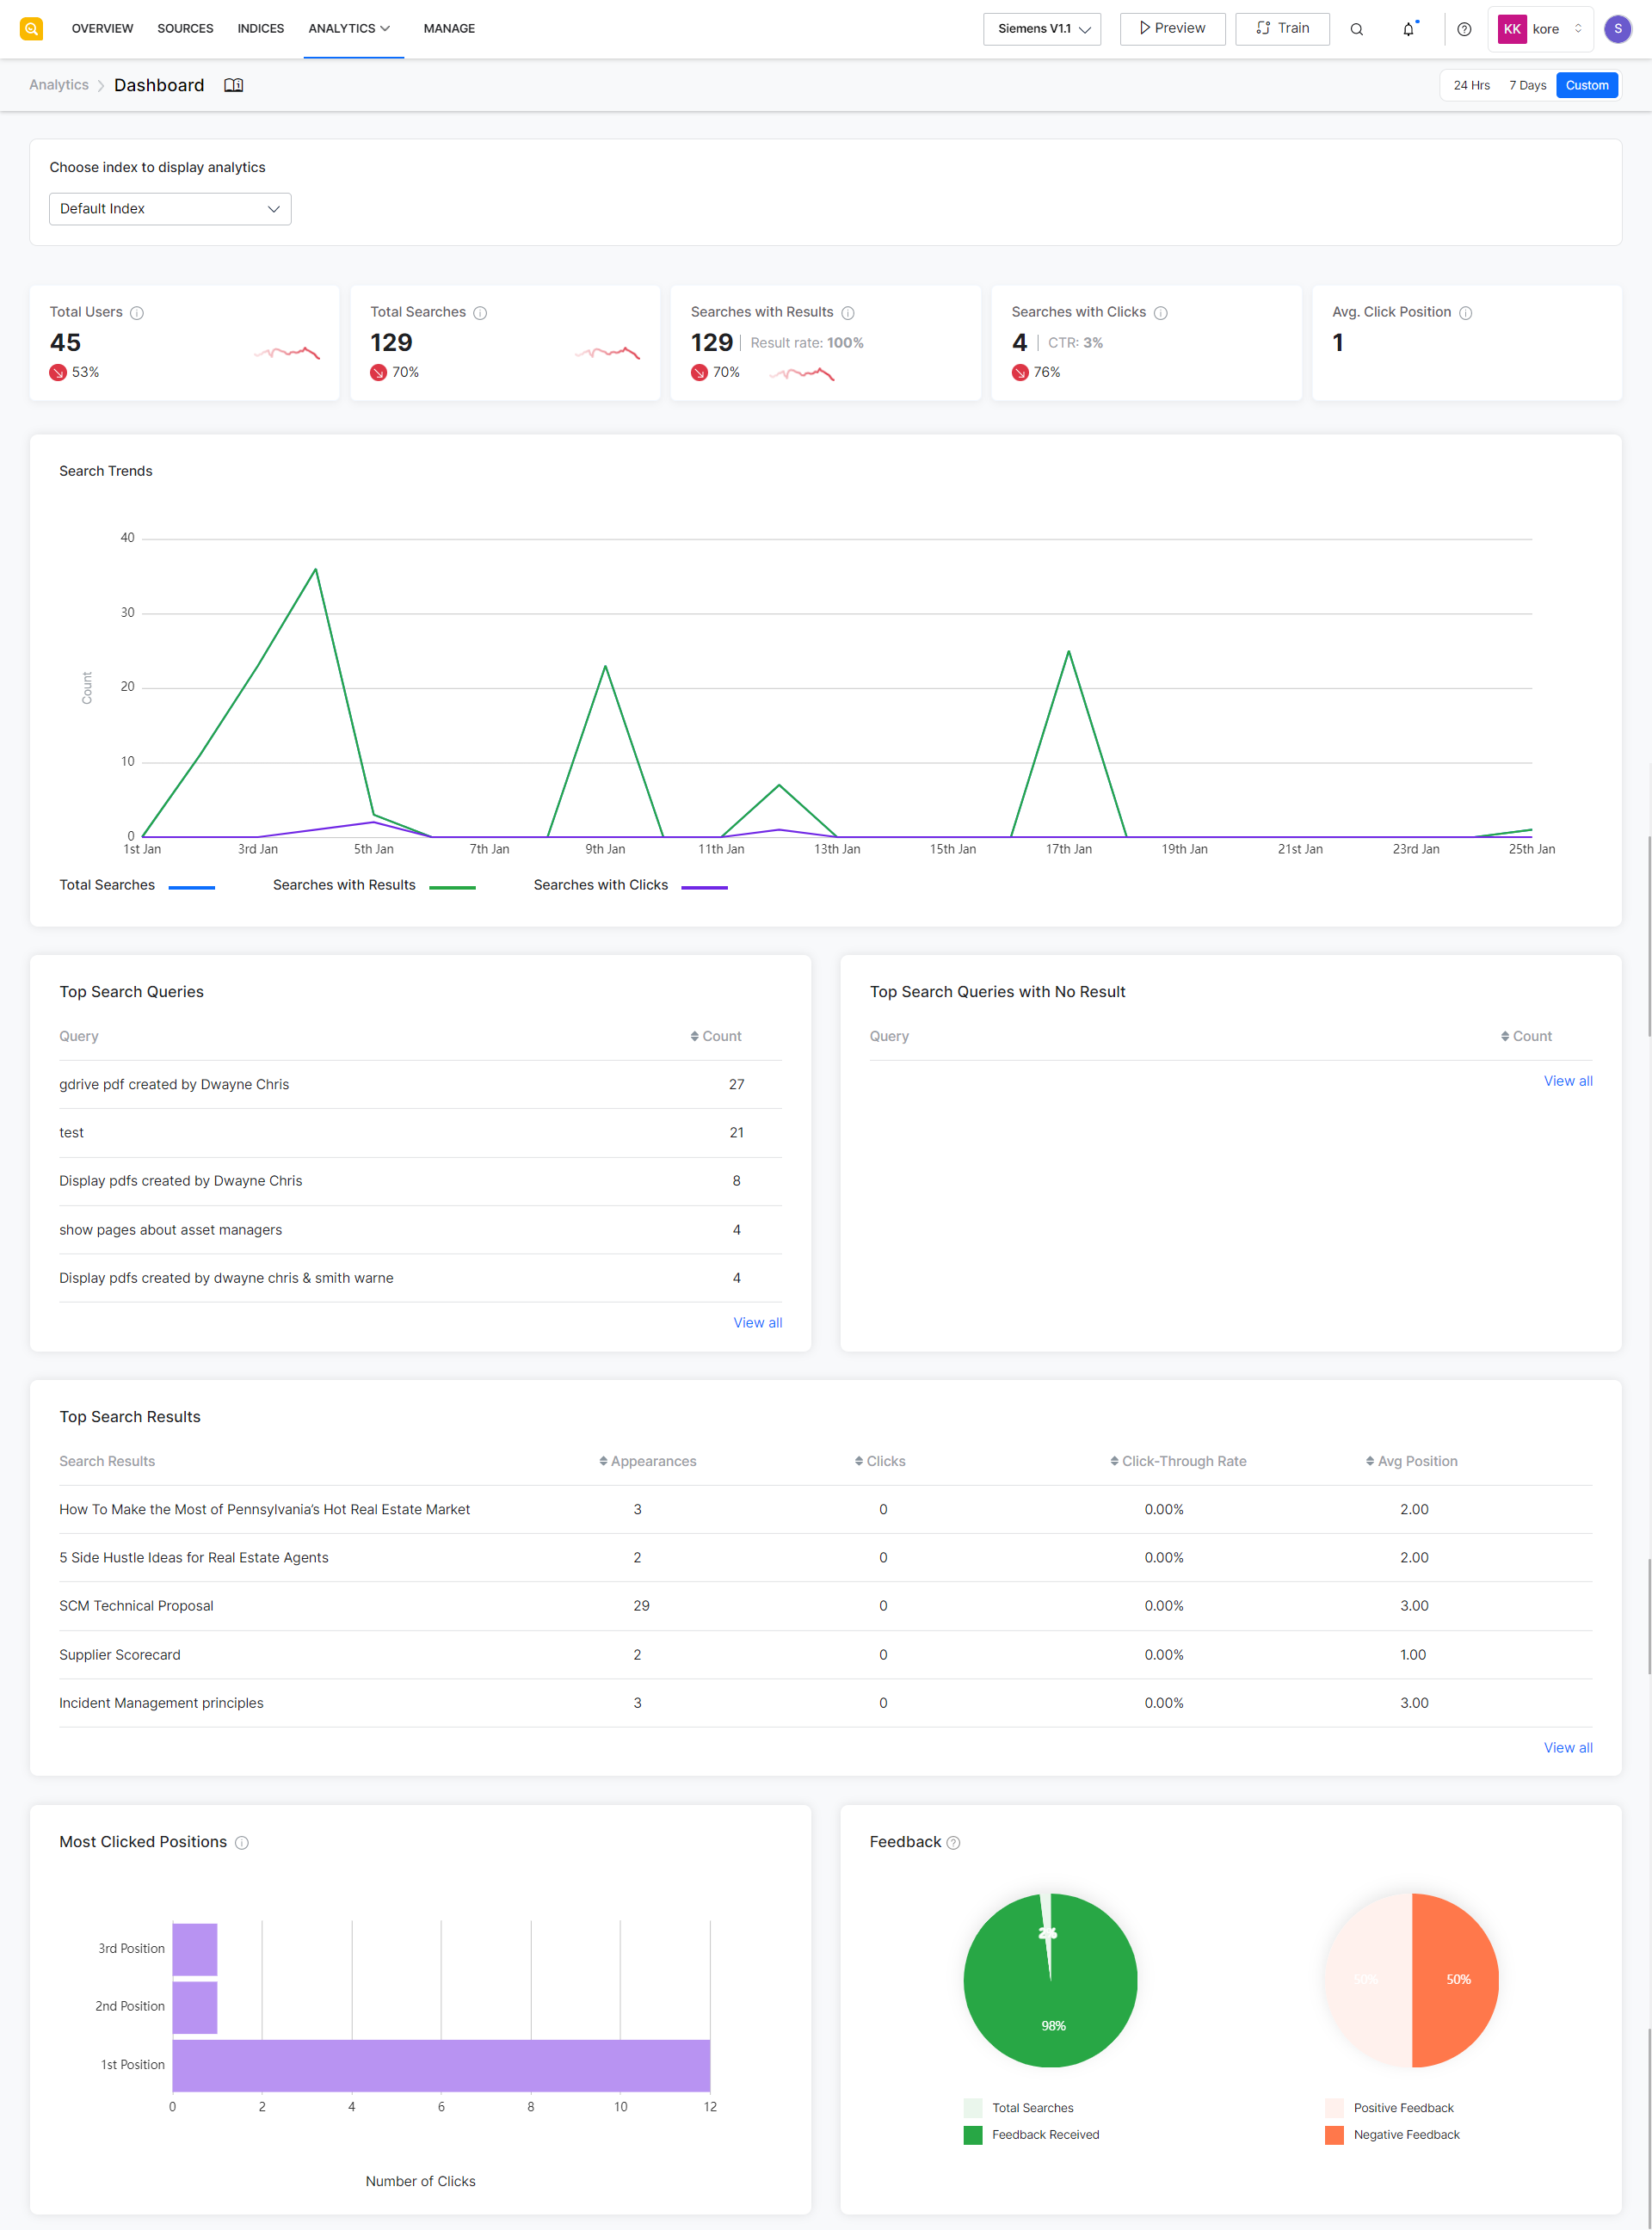
Dashboard provides an overview of the usage of the SearchAssist application and its performance with respect to user queries over time. It collects and displays data with respect to a given index configuration.
To view the metrics, choose the index configuration at the top.
| Metrics | Description |
| Total Users | Number of unique users who performed a search during the selected period. |
| Total Searches | Total number of search queries run using the SearchAssist app in the given time period. |
| Searches with Results | Total number of searches that yielded at least one result. |
| Searches with Clicks | Total number of searches where the user clicked at least one result. |
| Avg. Click Position | The average position of the clicks performed on the search results. For example, for a particular query for “iPad,” if there were
Average Click position will be 3.75 |
| Search Trends | Displays the total searches, searches with results and searches with clicks graphically. |
| Top search queries | The most frequently asked search queries along with the number of times that the queries were posted. |
| Top search queries with no results | The most frequently asked search queries that yielded no search results along with the number of times that the queries were posted. |
| Top search results | The search results that appeared the maximum number of times in the results along with their number of appearances, clicks, click-through rate, and average position. |
| Most clicked positions | Position at which search results were clicked by end-users the most number of times.
For example, in the above case, results at position 1 were clicked 12 number of times and the results at position 2 and 3 were clicked once. |
