
SearchAssist captures analytics on SearchAssist app utilization and performance for Search and Result phases. Analytics, the metrics related to Search Assist app usage, are built into informative dashboards.
Based on the insights drawn from the analytics, business users can make informed decisions to modify index and search configurations and/or improve content sections. Insights guide you to define experiments and determine the most suitable configurations that can improve the quality of the search experience and/or relevance of results.
Analytics Overview
Analytics is divided into five sections.
Experiments
Assess the impact of index and search configuration variations. Create experiments to evaluate multiple indexes and search configurations. To learn more, see Experimenting with Variants.
Dashboard
Provides an overview of SearchAssist app performance based on:
- Total users
- Total searches
- Searches with results
- Searches with clicks
- Average click position
User Engagement
Displays user engagement data such as:
- Total users
- New users
- Unique repeat users
- Busy hours
- User volume
To learn more, see Getting Insights from User Engagement.
Search Insights
Provides a quick overview of various metrics such as:
- Top search queries with results
- Queries without results
To learn more, see Getting Insights from Search Queries.
Results Insights
Provides valuable results information, which helps you understand user expectations such as:
- Appearances
- Number of clicks
- Click-through rate
- Average position
To learn more, see Getting Insights from Results.
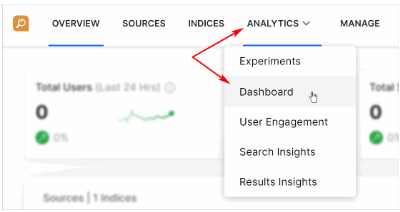
Accessing the SearchAssist Dashboard
The dashboard gives the highest level overview of SearchAssist app usage. It displays Total Users, Total Searches, Searches with Results, Searches with Clicks, and Average Click Position. For detailed analytics on specific aspects refer to the respective sections.
To access the dashboard:
- Click the Analytics menu tab.
- Select Dashboard on the drop-down menu.
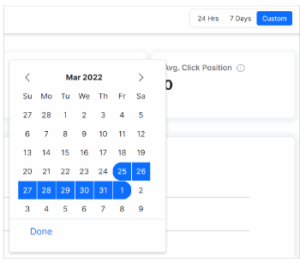
Filtering
You can filter the metrics for a specific time period:
- past 24 hours
- past 7 days selected by default
- custom period (select start and end dates on date picker)


Metrics
The following table defines the dashboard metrics.
| Metric | Description | Additional Notes |
| Live Data | ||
| Total Users | Number of unique users who accessed the SearchAssist app during the period. | |
| Total Searches | Total number of searches during the period. | |
| Result Rate | Percentage of searches that returned at least one result. | |
| Clicks | Number of searches with at least one result clicked by the search user. | |
| Average Click Position | Average position of clicks performed on the search results. For example, for the query “iPad,” if there were the following clicks:
Click position is (1 + 1 + 3 + 10) / 4 = 3.75 |
|
| Search Trends | Provides an overview of:
|
Metrics are displayed for the time period selected. Filter metrics based on Live Search and/or Full Page Search. |
| Top Search Queries |
|
Order on ascending or descending count of queries. The View all option to navigate to the corresponding tab in the insights section. For Top Search Queries, the results associated with the queries are displayed. |
| Top Search Queries with No Result | Top queries that yielded no results. Query-wise split is also displayed along with the number of times it was searched. | Order on the ascending or descending count of queries. the View all option to navigate to the corresponding tab in the insights section. |
| Top Search Results | Search results that appeared the most number of times. For each search result, the following details are listed:
|
Order on ascending or descending count of any of displayed parameters. Filter metrics based on the result type – FAQs, Pages, Tasks, etc. |
| Feedback | End-user feedback analysis.
|
|
| Most Clicked Position | Position at which search results were clicked by end-users the most number of times. Sorted in descending order. | |
Getting User Engagement Metrics
User Engagement metrics help teams understand the quality of user engagement and uncover potential gaps. SearchAssist’s User Engagement Metrics show relevant data with information on how end-users interact with the SearchAssist app.
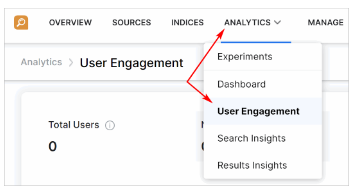
Follow these steps to access user engagement data:
- Click the Analytics menu tab.
- Click User Engagement on the drop-down menu.
Filtering
You can filter the metrics for a specific time period:
- past 24 hours
- past 7 days selected by default
- custom period (select start and end dates on date picker)
Metrics
The following table defines the user engagement metrics.
| Metrics | Details |
| User Data Trends | |
| Total Users | Number of unique users (based on the IP address) who performed a search during the selected period. |
| New Users | Number of new users who performed a search during the range selected. |
| Repeat Users | Number of returning users who performed a search during the range selected. |
| Busy Hours | Volume of users who performed a search at different hours of the day. Increase or reduce hours tracked per day using the slider below the graph. |
| Most Used Devices | Devices used by users to perform searches, sorted in descending order of usage numbers. For example, desktops, and mobile phones. |
| Most Used Browsers | Browsers used by users to perform searches, sorted in descending order of usage numbers. For example, Chrome, Firefox, IE, Safari. |
| Demographics | The geographical location (country-wise) of users performing searches, sorted in the descending order of usage numbers. |
Getting Insights from Search Queries
Draw insights from search query metrics. SearchAssist provides a list of end-user queries and the associated metrics.
Use the data to improve the end-user search experience. For example, if a search query was entered many times but did not return any results, then add appropriate content to the SearchAssist app. For example:
- E-commerce content If the query returns no result, procure the item or add an FAQ for the queried item stating it’s not available here.
- Enterprise portal If the query does not return the desired document, add a question-answer FAQ that points out the non-conformance and an optional reason.
A sizable number of no results for a query is a significant insight that points to an area requiring attention.
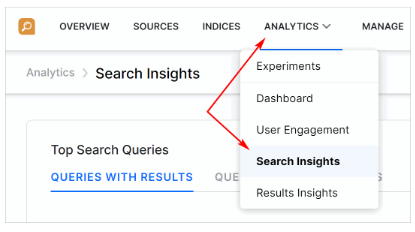
Follow these steps to access search insights:
- Click the Analytics menu tab.
- Click Search Insights on the drop-down menu.
- On the Search Insights page, find a list of search queries with and without results.
Filtering
You can filter the metrics for a specific time period:
- past 24 hours
- past 7 days selected by default
- custom period (select start and end dates on date picker)

Metrics
The following table lists the metrics displayed.
| Metrics | Details | Additional Notes |
| Queries with Result | ||
| Count | Number of times the particular query was asked by end-users. | Sort results in the ascending/descending order of count and/or clicks. For Top Search Queries, you can see the results associated with the queries. For each search result, view the following metrics: Appearances is the number of times the result appeared for the query.
Number of clicks is the number of times the result was clicked when it appeared. Click through rate is the number of unique clicks (multiple clicks count 1 each time the result appeared) / appearances. Avg. Position is the average position of the result for the search query. |
| Clicks | Number of times end-users clicked a particular query. | |
| Queries without Result | ||
| Count | Number of times end-users queried a particular query. | Sort the results in the ascending/descending order of the count |
Insights from Feedback on Results
SearchAssist Provides the ability to capture feedback from the end-user on the quality of results for a particular query for your deployed App. When designing experience as a business user you can enable the feedback capture toggle on or off, so that when your SearchAssist app is live the end-users can enter their feedback on the quality of the results for each of their queries, either positive or negative.
Results that are considered close and relevant to the query get positive feedback and the irrelevant ones get negative feedback. Negative feedback for the result of the query can be used to rectify the result or to tag the right result for that query. Percentages of the feedback are calculated based on the captured feedback and displayed in the dashboard.
Note: The end-users have the choice to be neutral, i.e., giving feedback is an option and not mandatory, in such cases no feedback is captured.
As a business user, you can view the metrics on the feedback entered by users in SearchAssist Dashboard either
- for the currently deployed SearchAssist App, or
- for the duration of a selected time window if applicable i.e., if the feedback capturing has been enabled for that selected time duration during the experience-designing phase.
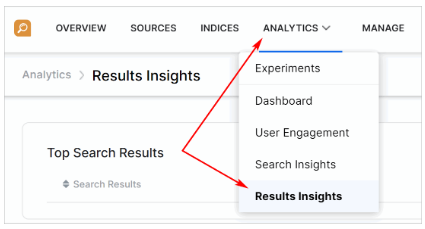
Getting Insights from Results
SearchAssist provides insights on all results for user queries along with associated metrics. Use the information to improve results and make them more relevant.
Follow these steps to access results insights:
- Click the Analytics menu tab.
- Click Results Insights on the drop-down menu.
Filtering
You can filter the metrics for a specific time period:
- past 24 hours
- past 7 days selected by default
- custom period (select start and end dates on date picker)

Metrics
The following table lists the metrics displayed.
| Metrics | Description | Notes |
| Appearances | Number of times the result appeared for any user query. | For Top Search Results, see the queries associated with the results. |
| Number of clicks | Number of times the user clicked the result. | |
| Click-through rate | Number of unique clicks (multiple clicks count as 1 each time the result appeared) per appearance. | |
| Avg. Position | Average position of the result for the search query. |