Supervisor Dashboard
Overview
From a supervisor’s perspective, the Dashboard Overview presents a comprehensive 360-degree view of audit details, failure statistics, and performance monitoring for the agent Evaluation forms across daily, weekly, and monthly intervals. By default, it displays the daily report for all three categories, giving supervisors a quick and easy way to monitor quality standards at any given time.
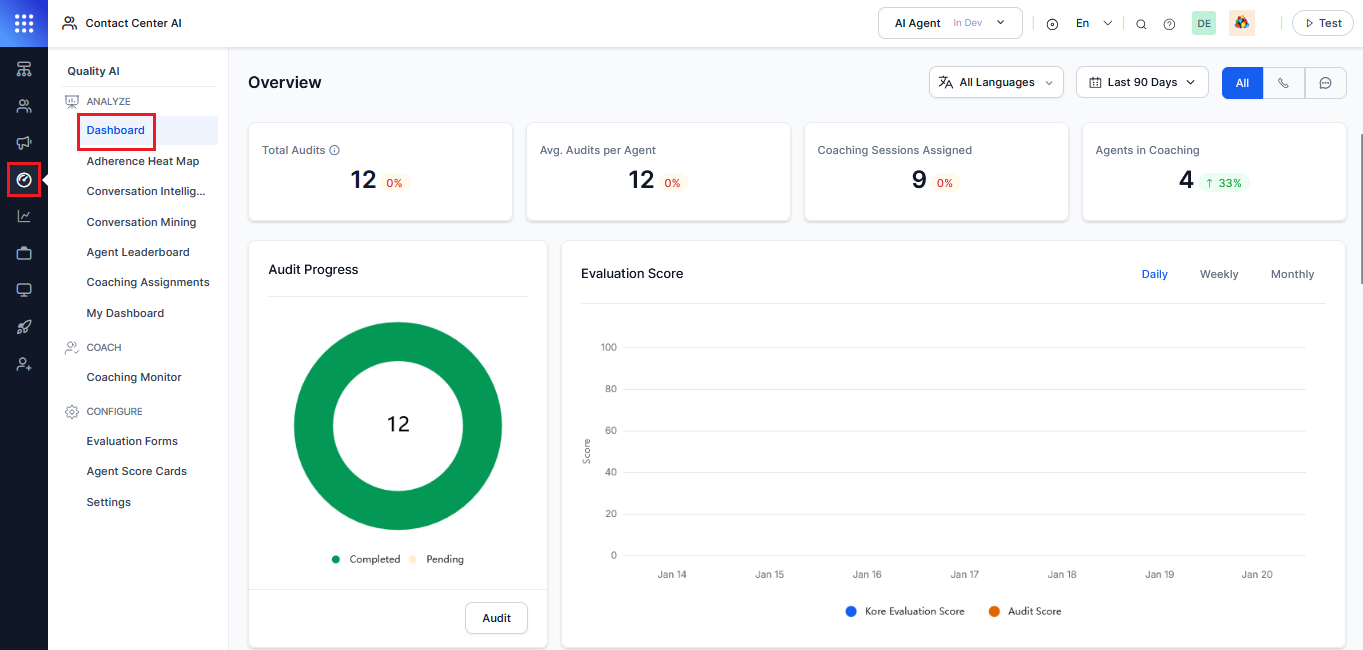
You can access Dashboard by navigating to Contact Center AI > Quality AI > Analyze > Dashboard.
Note
To access this Dashboard feature, you need to enable Auto QA and set up an evaluation form in the Settings to generate Auto QA scores. Only users with permission to access QA functionality can view it.
Dashboard Filters
This Dashboard lets you filter the data based on language, time period, and channel selected.
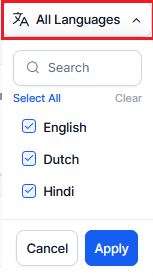
All Languages
In this Quality AI Dashboard, you can filter and search by language across the dashboards and interaction listing pages to search and apply the language-specific metrics. These metrics are available based on the languages configured at the evaluation metric level under the Configuration > Settings > Language Settings.
Note
By default, all languages are selected when the All Languages filter is applied. Only metrics configured for the selected languages are displayed under this filter.
When any of the language filters are selected, the following widget metrics are updated:
-
Total Audits
-
Avg. Audits per Agent
-
Evaluation Score (Manual Vs Auto QA score)
-
Fail Statistics (Evaluation Form)
-
Performance Monitor (Evaluation Form)
Date and Time Range
You can filter data based on a selected date and time range.
To filter a range, click the Calendar drop-down list displayed in the top-right corner of your Dashboard page. Select a date and time range from the list, and click Apply.
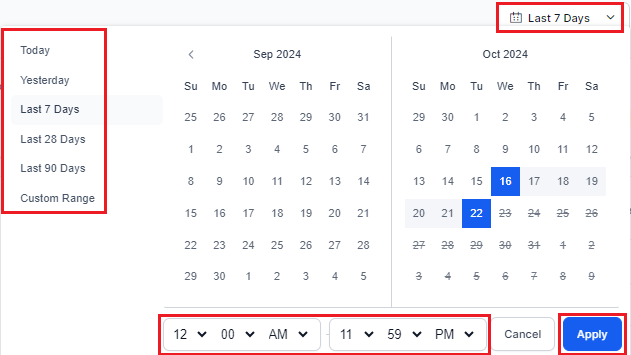
This allows you to filter all agent interaction data by selecting the following date with time ranges:
- Today: All interaction data for this day, in the agent’s time zone.
- Yesterday: All interaction data of the previous day, in the agent’s time zone.
- Last 7 Days: All interaction data for the previous 7 days (not including today), in the agent’s time zone.
- Last 28 Days: All interaction data for the previous 28 days, (not including today), in the agent’s time zone.
- Last 90 Days: All interaction data for the previous 90 days, (not including today), in the agent’s time zone.
- Custom Range: All interaction data from the given date (12:00:00 AM to 11:59:59 PM), in the agent’s time zone, limited to 31 days.
Channel
The Quality AI Dashboard's default settings display combined data from all three channels — Voice, Chat, and All. You can filter the performance metrics by channel, such as Voice, Chat, or All (Voice and Chat) conversations. The dashboard provides trends and graphs with daily, weekly, and monthly views, along with a distribution view.
To filter data by channel, click the All Channels button in the top-right corner of the dashboard page, then select a conversation channel you wish to view.
Agent Performance Metrics
The following are the metrics components to assess agent performance (audits) and to track coaching progress:
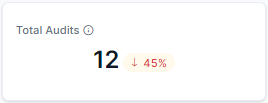
Total Audits
Displays the total manual audits count completed based on the date range selected.
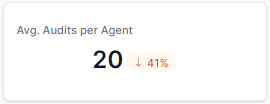
Avg. Audits per Agent
Displays the average number of manual audits per agent or evaluations completed belonging to the queues of a user.
Coaching Sessions Assigned
Displays the number of coaching sessions the user (supervisor) has assigned across agents within a specific time period.

Agents in Coaching
Displays the number of agents with an active coaching assignment in the queues that the user belongs to.

Audit Progress
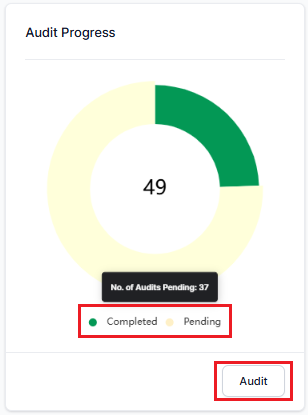
Displays the total number of audits (progress score) pending and completed.
- Completed: Number of assigned interactions that are audited.
- Pending: Number of interactions assigned for audit and not yet audited.
- Audit: Click the Audit button, which directs you to the Conversation Mining > Audit Allocations feature, where you can easily start evaluating interactions.
For more information, see Audit Allocations.
Evaluation Score
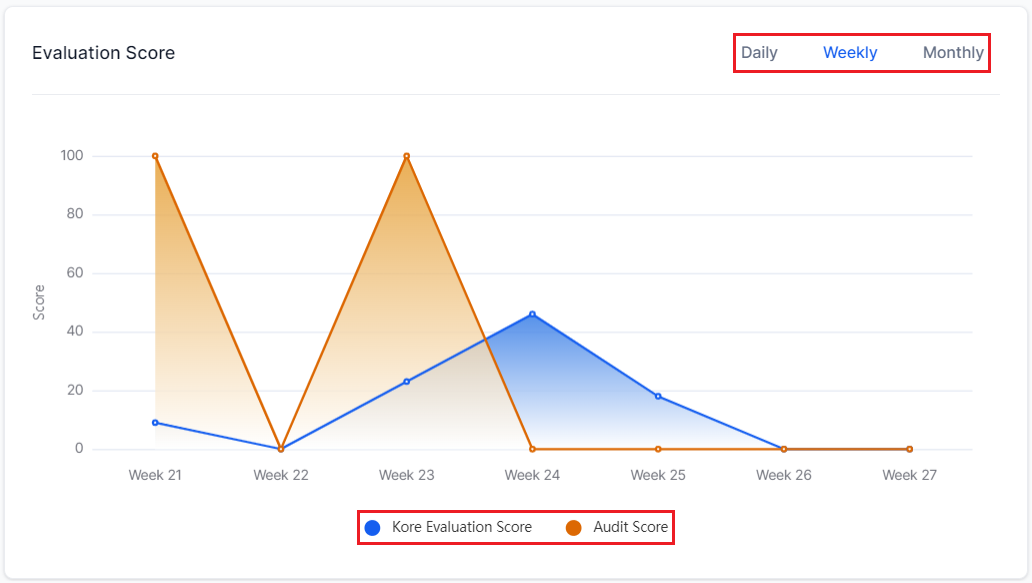
This displays the trend of the average Kore Evaluation Score (Auto QA Score) alongside the average Audit Score (manual), allowing you to compare the consistency between system-generated evaluations and manual audits.
You can view both automated interactions and manual audits scores across the following date ranges:
- Daily: Displays score for the last 7 days.
- Weekly: Displays score for the last 7 weeks.
- Monthly: Displays score for the last 7 months.
Adherence Heat Map
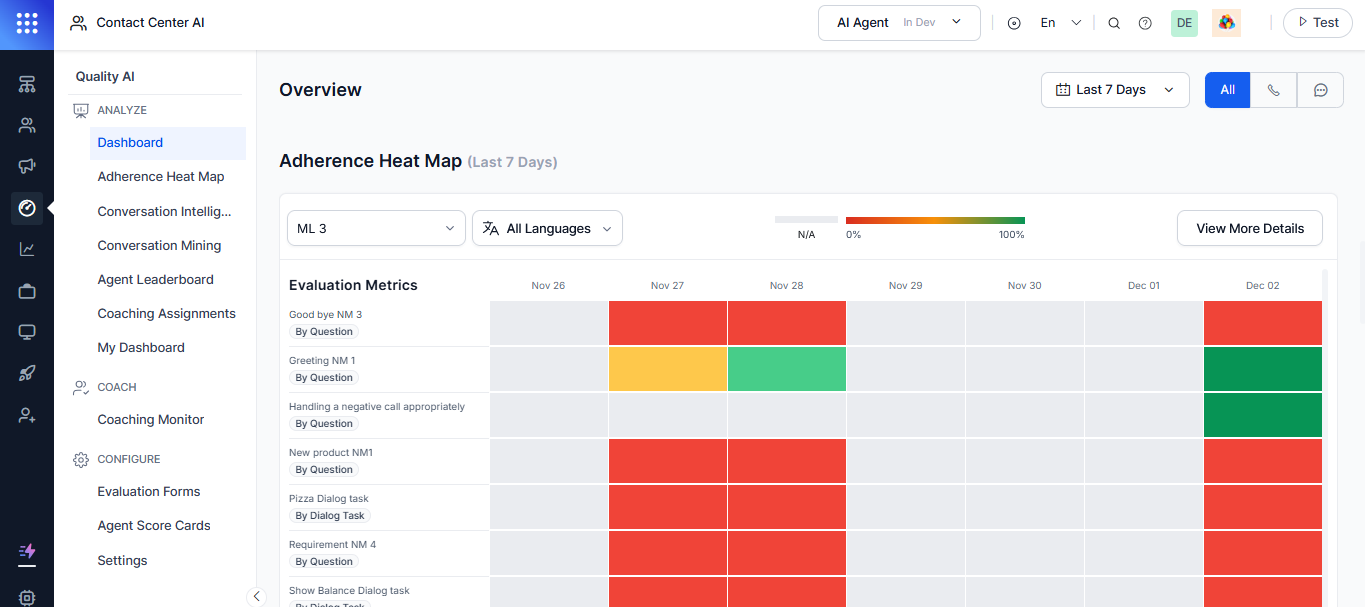
The QA Dashboard feature displays a condensed heatmap of adherence data for the last 7 days, with a default form selection, and no click-through functionality. You can select the evaluation form from the drop-down, and set it as the default queue for viewing adherence across the heatmap and the QA dashboard. In this, the hover tooltip displays the metrics for selected agents of the corresponding date, including % adherence, interaction count, and total interactions.
Fail Statistics
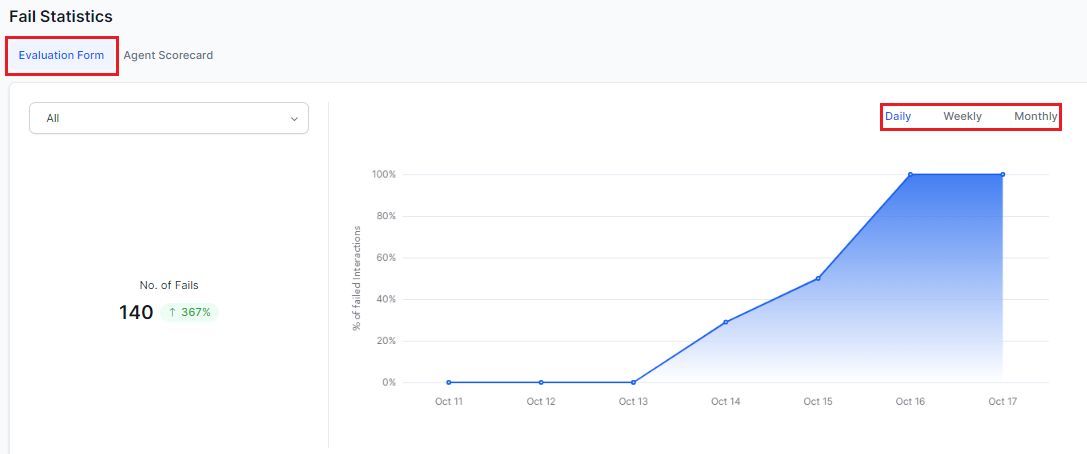
This chart displays the count of failed interactions based on the selected Evaluation forms and date range. It allows you to visualize failure trends for the chosen Evaluation forms over the last 7 days, 7 weeks, or 7 months (using daily, weekly, and monthly) views. Overall, it provides failure statistics for evaluation forms and scorecards for a specified time period.
Evaluation Form
This chart displays failure rates across the selected evaluation forms, making it easy to track any increases in failure rates. It allows you to quickly identify issues and take appropriate action, without the need to manually review individual failed interactions.
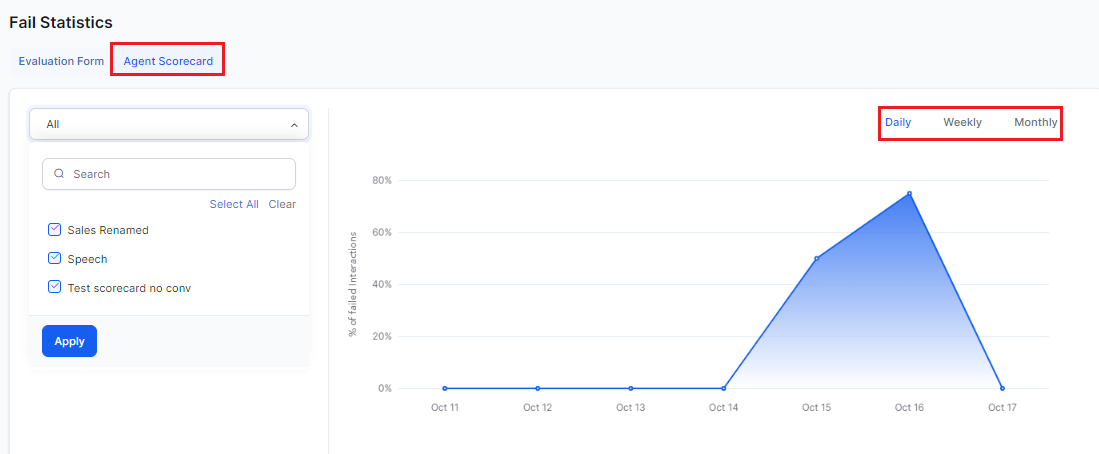
Agent Scorecard
This chart displays the trend view of the percentage of interactions with agent scorecard failures based on the selected scorecard.
Note
This Agent Scorecard tab only appears on the Dashboard if the widget option is enabled in the Settings of the Quality AI General Settings.
Performance Monitor
This displays the total score of the Performance Monitor based on the Date Range and Evaluation Form selected.
Evaluation Form
Supervisors can monitor agent performance based on the selected evaluation form.
-
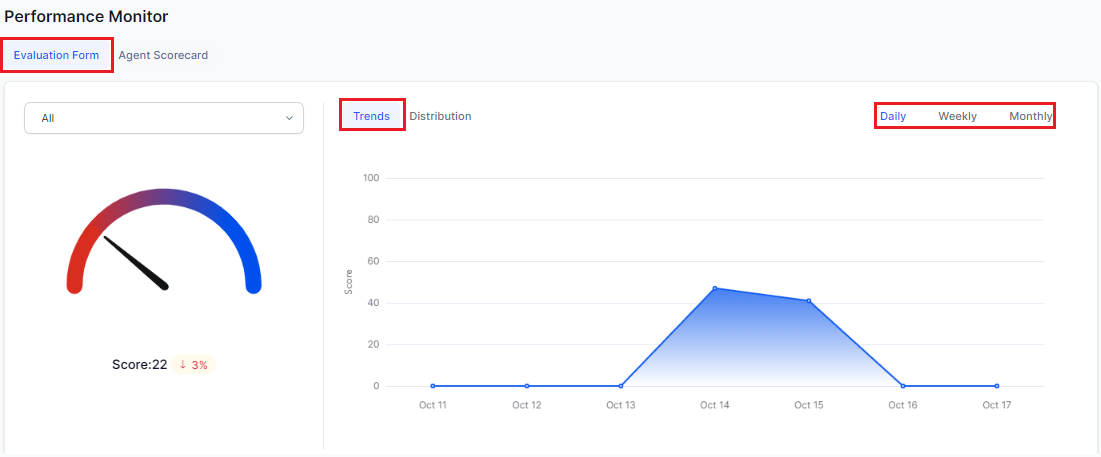
Trends: The Performance Monitor provides a Trends view (agent performance) that visualizes the average Kore Evaluation scores from agent scorecards on a daily, weekly, and monthly basis.
-
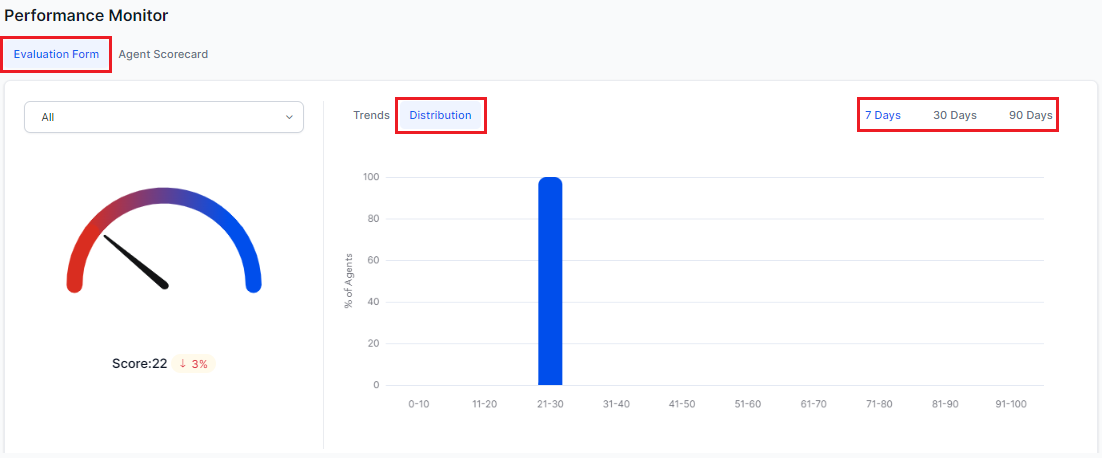
Distribution: This view displays the distribution of both Kore evaluation scores and agents scorecard scores over the last 7 days, 30 days and 90 days.
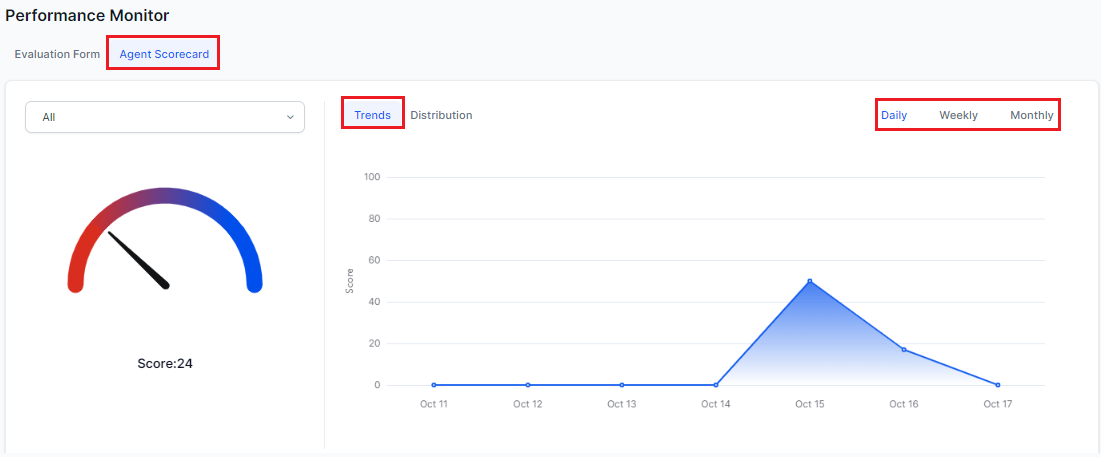
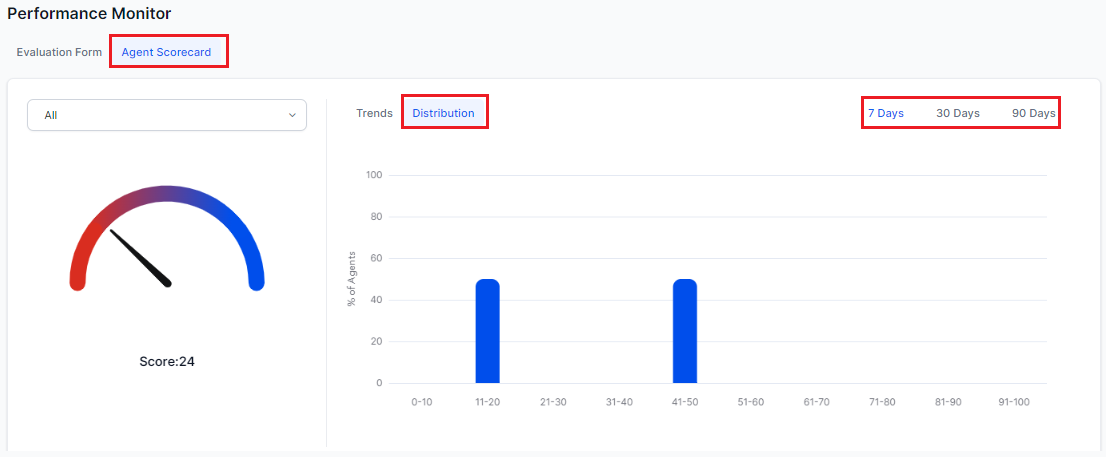
Agent Scorecard
-
Trends: This view displays the performance monitor for agent scorecards.
-
Distribution: This view displays how agents are distributed across score bands in increments of 10 over the last 7 days, 30 days and 90 days.
Agent Leaderboard
This widget provides a simplified view of the Agent Leaderboard and a snapshot version of agent performance. The Agent Leaderboard displays a centralized view that makes it easy to identify the best and worst performers. It enables you to make informed decisions about rewarding high performers and assigning coaching to those agents who need improvement.

Note
To access this feature, enable the Agent Scorecard toggle option in the Quality AI displayed under Settings.
The Agent Leaderboard displays the following items:
-
Agents: This displays the agent group name and the queue to which the agent is assigned.
-
Audits Done: This displays the total number of manual audits completed by agents.
-
Audit Score: This displays the average score of the manual audit.
-
Kore Evaluation Score: This displays the average Kore Evaluation Score for each audited interaction.
-
Fail Percentage: This displays the percentage of failures across all interactions.
View Leaderboard
This View Leaderboard or Agent Leaderboard feature allows auditors and managers to view both top and bottom-performing agents, along with their conversations.
Click the View Leaderboard button, the following screen is displayed that navigates you to the Agent Leaderboard page.

For more information, see Agent Leaderboard.
