

Customer Insights
The Customer Insights page helps you understand what customers are asking about and how they feel about the experience. It combines intent classification, sentiment scoring, frustration detection, and resolution tracking into a single view to help you identify emerging topics, detect dissatisfaction early, and measure whether the agent resolves the intents it encounters. Navigation: Project → Insights → Customer Insights Date range selector: Use the toggle to select 7d, 30d, or 90d.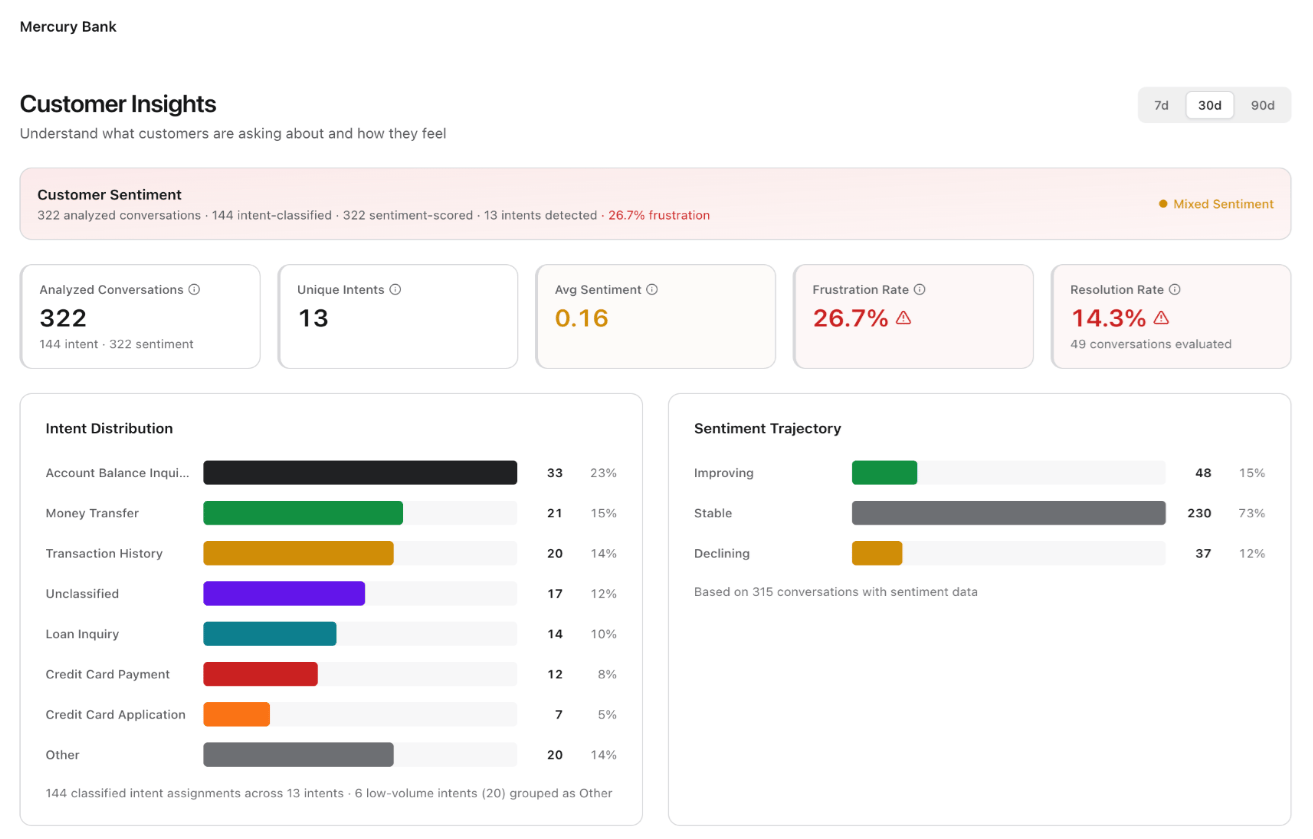
Customer Sentiment Summary
A banner at the top displays a contextual summary of the analyzed data, for example: “322 analyzed conversations · 144 intent-classified · 322 sentiment-scored · 13 intents detected · 26.7% frustration.” A sentiment indicator (for example, “Mixed Sentiment”) provides a quick qualitative read.KPI Metric Cards
Intent Distribution
A horizontal bar chart ranks detected intents by volume. Each bar shows the intent name, count, and percentage of total conversations. The chart groups low-volume intents (typically those below a threshold count) into an “Other” category. The footer indicates the total classified intent assignments and how many low-volume intents the chart grouped.Sentiment Trajectory
A side-by-side panel displays conversation counts across three sentiment directions:
The footer indicates the total conversations with sentiment data contributing to the trajectory analysis.
Trends Over Time
A section below the distribution charts plots intent volumes and sentiment scores as time-series data, enabling you to track whether specific intents are growing or shrinking and whether sentiment is trending in the right direction.Feedback
The Feedback page surfaces end-user feedback captured directly from chat sessions. It gives you access to raw ratings and verbatim comments so you can identify satisfaction patterns, detect underperforming agents or channels, and prioritize improvements based on what users say. Navigation: Project → Insights → Feedback Date range selector: Use the toggle to select Today, 7d, or 30d.Filters
Four filter controls let you narrow feedback results:
Click Refresh to reload feedback data with the current filter selections.