Dashboard
The Dashboard page — titled At a Glance in the interface — provides a pre-built executive overview of your AI agent program. It aggregates key performance indicators, trend visualizations, outcome breakdowns, and a conversation-level drill-down into a single view, giving stakeholders immediate visibility into agent performance without any configuration. Use it as the starting point for daily operational checks or to prepare data for leadership reviews. Navigation: Project → Insights → Dashboard Date range selector: A toggle in the top-right corner lets you select 7d, 30d (default), or 90d. Changing the range refreshes all KPI cards, charts, and conversation data on the page.
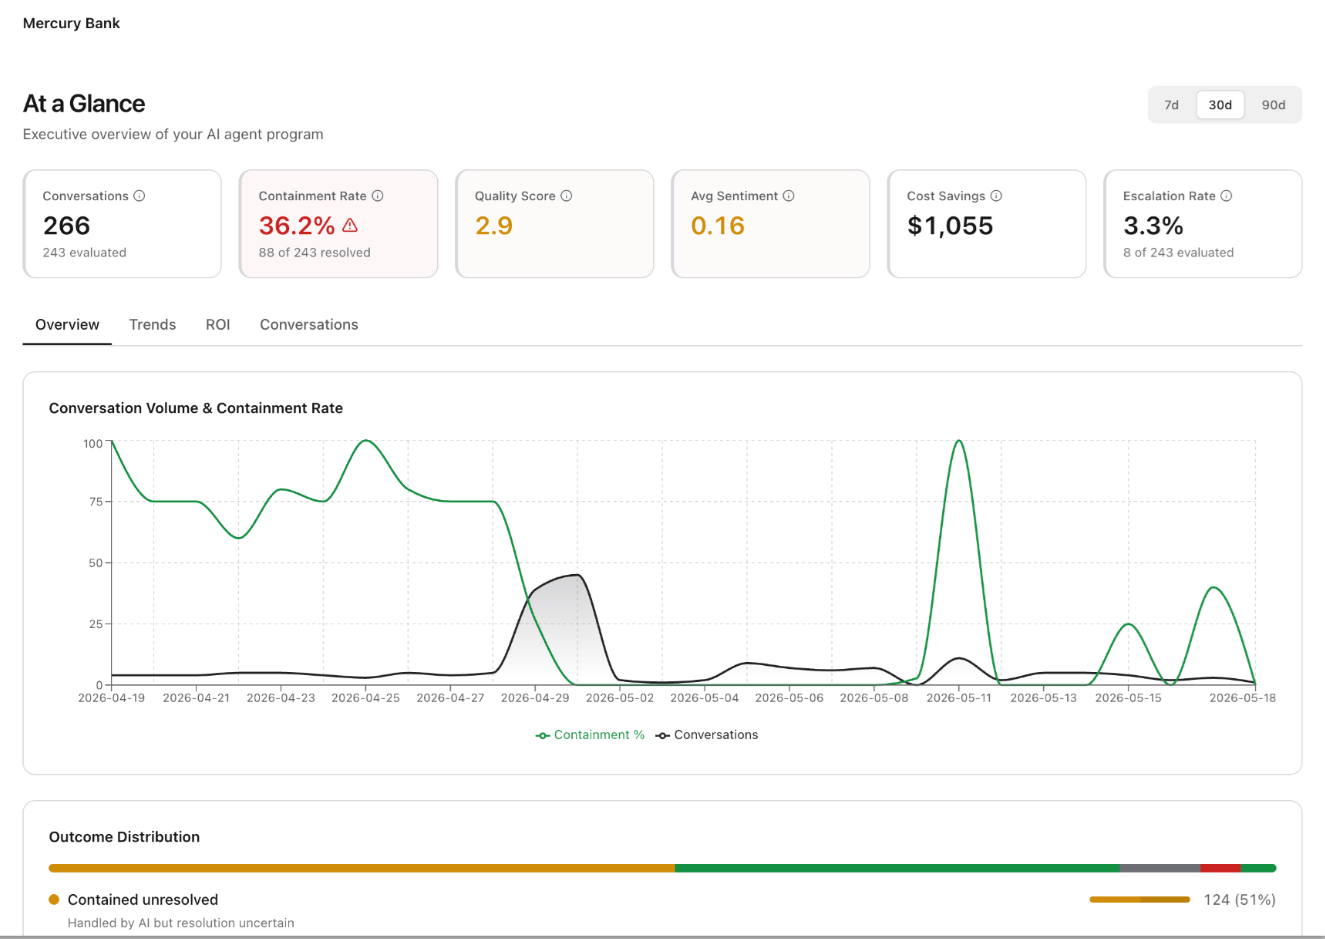
KPI Metric Cards
Six metric cards appear at the top of the page. Each card displays a primary value and, where applicable, a sub-label with supporting context. Warning icons appear on cards where the metric falls below expected thresholds.| Metric | Description |
|---|---|
| Conversations | Total conversation count in the selected period. The sub-label shows how many conversations pipelines evaluated. |
| Containment Rate | Percentage of sessions the agent resolved without human escalation. A warning icon appears when the rate drops below the platform-configured threshold. The sub-label shows the resolved count versus the total evaluated. |
| Quality Score | Aggregated quality score across all evaluated conversations, derived from pipeline evaluations. Displays a dash (–) if no quality pipeline has processed data yet. |
| Avg Sentiment | Average sentiment score across all conversations in the period. Displays a dash (–) if the sentiment pipeline has not yet run or if the platform lacks sufficient data. |
| Cost Savings | Estimated cost savings compared to human-handled conversations. A positive value indicates cost-efficiency; a negative value indicates the program has not yet reached cost parity with human support. |
| Escalation Rate | Percentage of sessions escalated to a human agent. The sub-label shows the escalated count versus the total evaluated. |
Views
Below the KPI cards, four views organize the dashboard’s detailed data:| View | What it shows |
|---|---|
| Overview | A Conversation Volume & Containment Rate trend chart plotting daily conversation count and containment percentage over the selected period. Below the chart, an Outcome Distribution horizontal bar breaks down conversations into three categories: Resolved (green), Contained-unresolved (amber: the AI handled the conversation but resolution remains uncertain), and Escalated (red). Each segment shows its count and percentage. |
| Trends | Longitudinal trend lines for all core KPIs — conversations, containment, quality, sentiment, cost savings, and escalation — over the selected period. Use this view to identify sustained improvements or regressions across multiple metrics simultaneously. |
| ROI | Return-on-investment metrics comparing agent costs to human-handled baselines. Includes cost-per-conversation, total savings, and efficiency ratios. |
| Conversations | A filterable, sortable list of individual conversations with columns for status, outcome, agent name, duration, and key metrics. Click any row to open the full conversation detail. |
Analytics
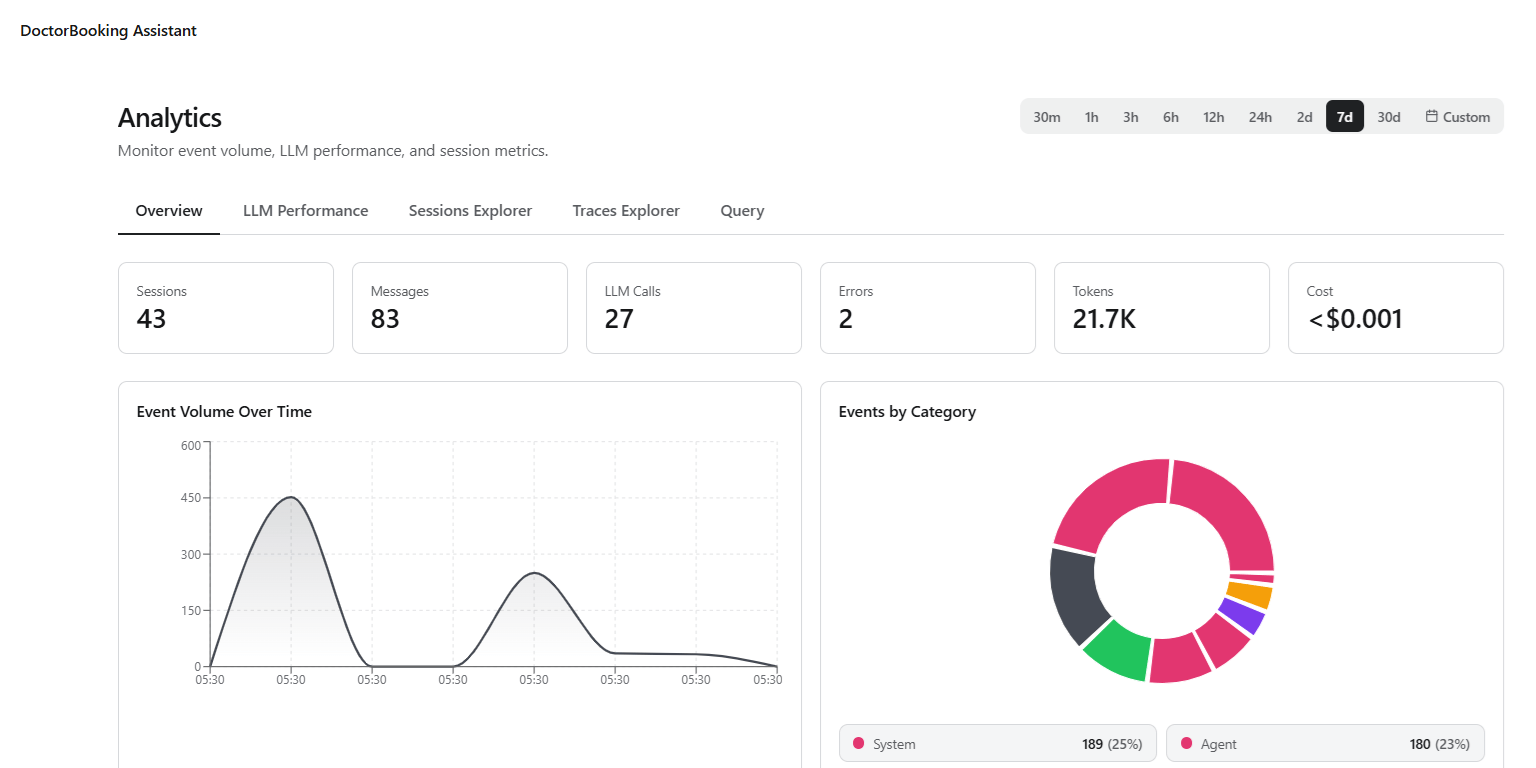
The Analytics page monitors event volume, LLM performance, token consumption, and cost in near real time. Unlike the Dashboard, it offers granular time controls down to 30-minute windows — useful for investigating production incidents, tracking the impact of model changes, or auditing LLM spend during peak traffic. Navigation: Project → Insights → Analytics Time range controls: Analytics supports the most granular time ranges in the Insights section: 30m, 1h, 3h, 6h, 12h, 24h, 2d, 7d, 30d, or a Custom range where you specify exact start and end timestamps. This granularity is especially useful for correlating agent errors or latency spikes with specific deployment events.
Overview
Six metric cards summarize the selected period at a glance:| Metric | Description |
|---|---|
| Sessions | Total sessions in the selected period. A session represents a single end-to-end interaction between a user and the agent system. |
| Messages | Total messages across all sessions, including both user messages and agent responses. |
| LLM Calls | Total LLM API calls agents made during the period. Includes calls to all configured models (for example, routing, generation, evaluation). |
| Errors | Total errors during agent execution, including LLM failures, timeout errors, and tool invocation errors. |
| Tokens | Total LLM tokens (input + output) across all calls. |
| Cost | Estimated cost based on token usage and per-model pricing. Use this to track spend against budgets or compare cost-efficiency across model configurations. |
Additional Views
| View | Purpose |
|---|---|
| LLM Performance | Model-level metrics including per-call latency distributions, average tokens per call, error rates by model, and throughput. Use this view to benchmark model performance and identify candidates for optimization or replacement. |
| Sessions Explorer | Browse and filter individual sessions with full conversation details, trace counts, token usage, and duration. Each session row expands into a detailed view with turn-by-turn replay, token breakdown, and model information. |
| Traces Explorer | Search and inspect individual trace events across sessions. Filter by event type, agent name, or error status to isolate specific execution paths for debugging. |
| Query | Run custom analytics queries against project event data using a query interface. Useful for ad-hoc investigations that don’t fit pre-built views. |
Session Detail View
When you open a session from the Sessions Explorer (or from the Trace Viewer under Evaluate), the platform displays a comprehensive session detail page with the following sections:| Section | Details |
|---|---|
| Session header | Session ID, agent name, trace status badge (for example, “history / partial”), total traces, total tokens, and session cost in a summary bar at the top. |
| Conversation pane | Full turn-by-turn dialog replay showing user messages and agent responses. Each agent’s turn displays the responding agent’s name and response latency. Multi-agent sessions show hand-offs between agents. |
| Session Overview tab | Agent name, session ID, message count, trace event count, connection state (Connected / Disconnected), and timestamps (Started, Finished). |
| Token Breakdown | Tokens In, Tokens Out, Total Tokens, LLM Calls count, and total Cost in a grid of metric cards. |
| Models Used | Lists each LLM model the session invoked, with its model identifier and version string. |
| Trace tabs | Tabbed navigation across: Overview, Traces, Errors, Data, Conversation, Performance, IR (Intermediate Representation), and a Traces download option. |
| Timeout Diagnostics | Browser idle timeout and Access Token TTL values for the session, useful for diagnosing disconnections. |