

Test in Studio
Use Studio to validate agent behavior interactively before deploying to production. Depending on your project configuration, you can test agents using chat or voice. Both use the same execution pipeline as production, including:- Tool calls and their results.
- Flow step transitions.
- Handoffs between agents.
- Guardrail checks on inputs and outputs.
Start a test session
- Open your project in Studio.
- To test the full project, go to the Overview page and click Test your agents. For multi-agent projects, Studio defaults to the project’s entry agent (usually the supervisor).
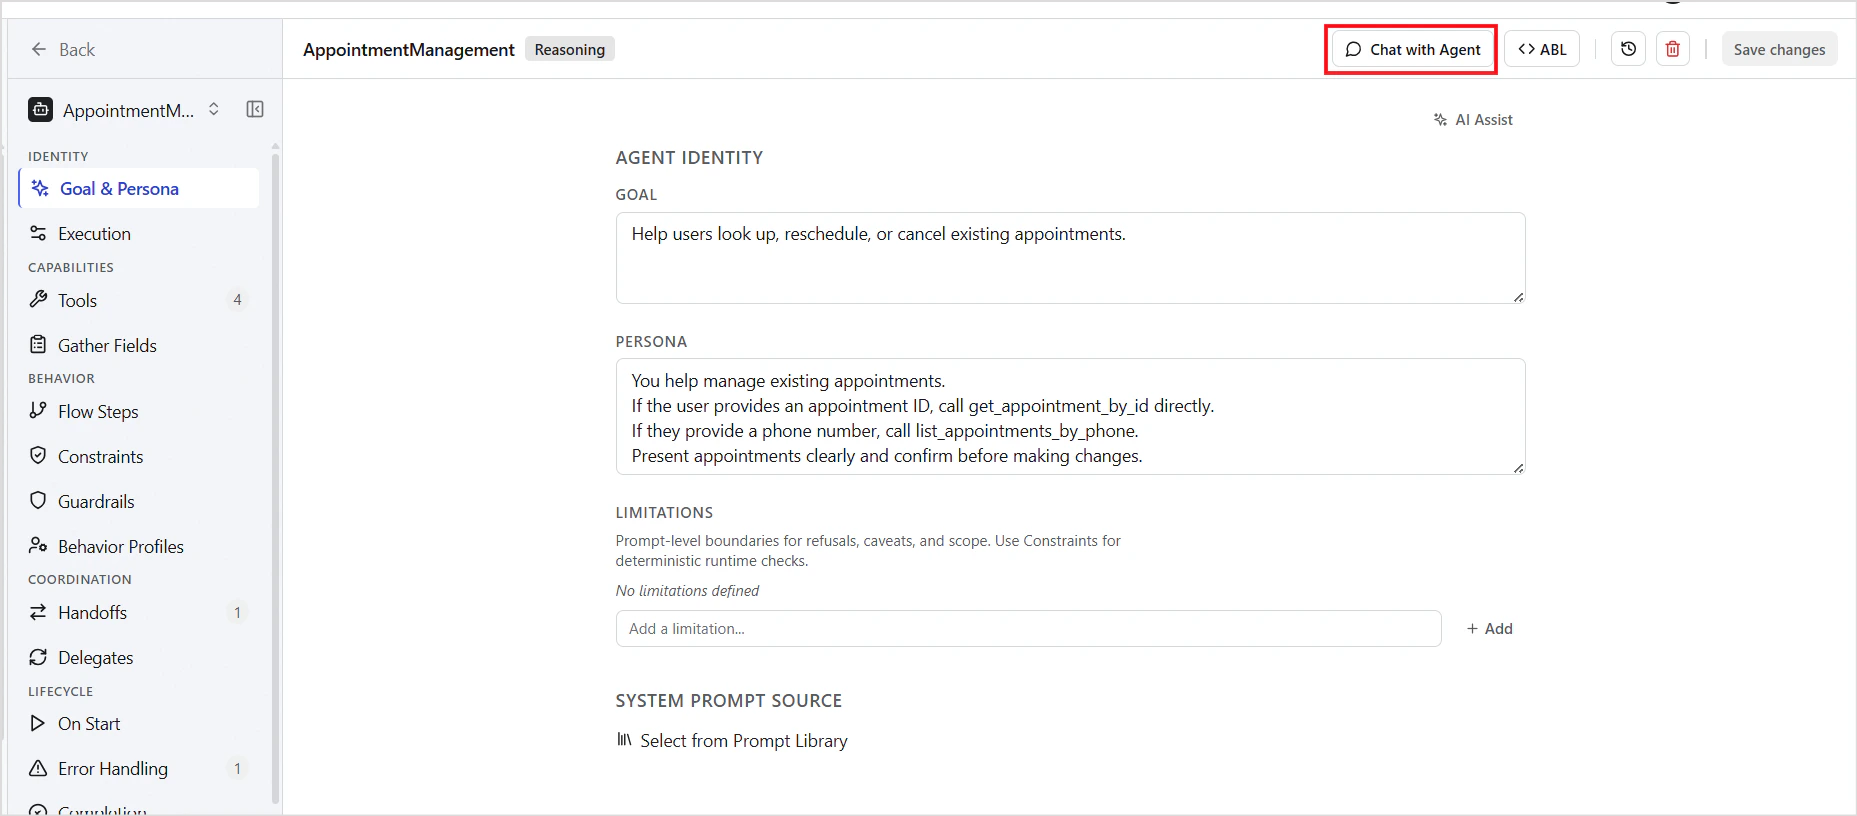
- To test an individual agent in isolation, go to the Agent page and click Chat with Agent.
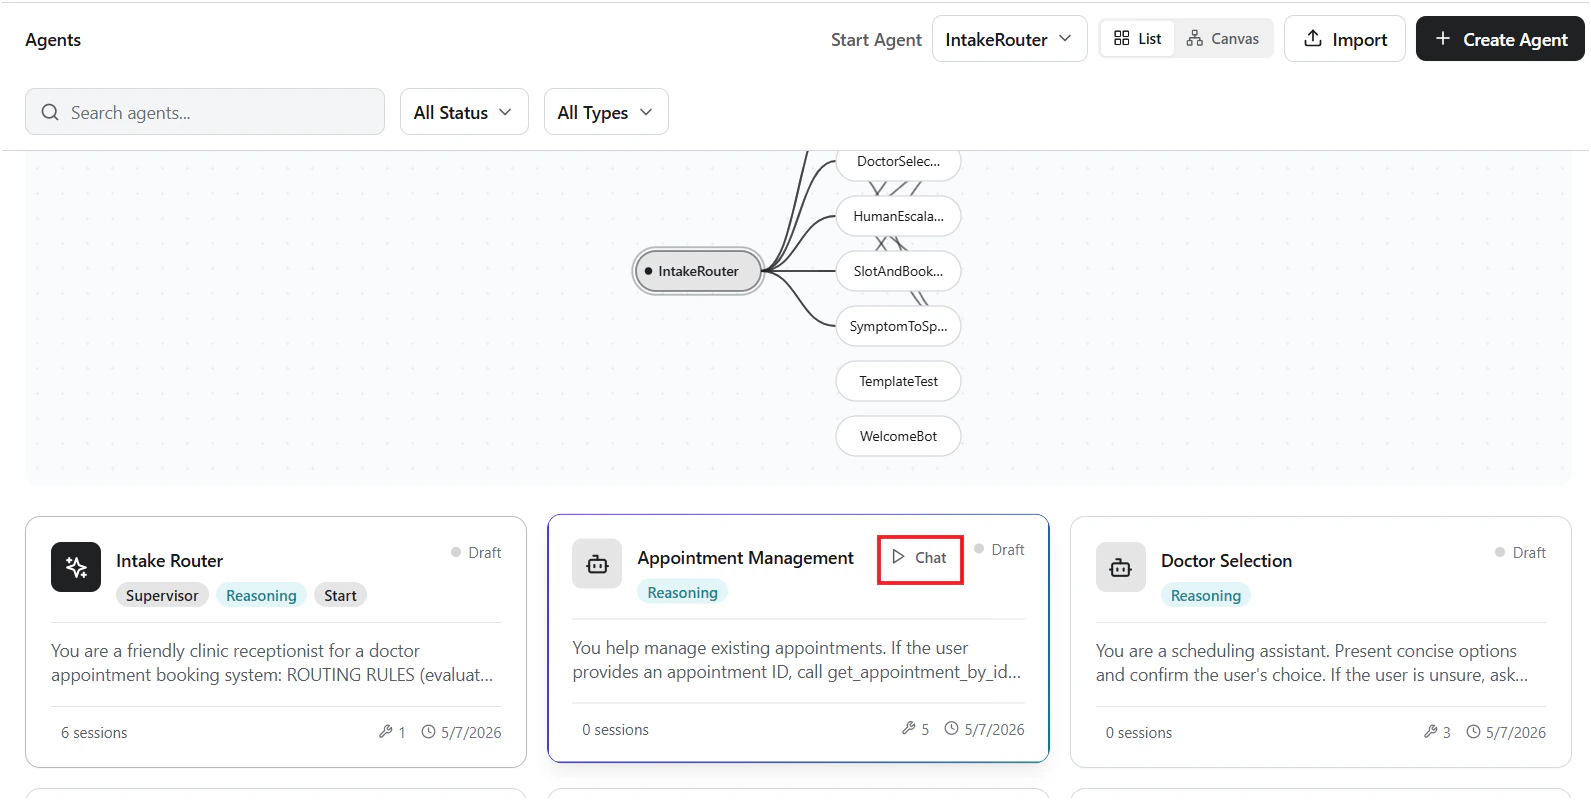
- Or use the Chat option next to any agent on the Overview page.
- Studio creates a test session.
- Chat: Type a message in the chat input and press Enter.
- Voice: Select the Voice tab, choose a configured test target, and click Start Call. Speak to the agent using the built-in softphone. A live transcript is displayed during the call.
- During testing, Studio displays runtime information such as:
- Executed flow steps
- Tool invocations
- Response time
- Live conversation transcript (voice sessions)
Debug view
The Session Debug view provides real-time visibility into agent execution during a conversation. Use it to inspect responses, trace execution flow, monitor token usage, and diagnose runtime issues. The left panel displays active and historical chat sessions. The center panel shows the live conversation between the user and the agent, including routed responses and workflow progression. The right-side diagnostics panel provides detailed runtime insights such as trace events, model usage, token consumption, session identifiers, and timeout diagnostics in real-time.
For voice test sessions, the debug view also displays the live call transcript. After the call is complete, you can inspect the session and its execution traces in the same way as chat sessions.
Using traces to debug
Use traces to inspect every decision, tool call, state update, and handoff during execution.- Open your project in Studio.
- Navigate to Sessions and select a session.
- Click the Traces tab to view the full execution trace.
- Use filters to narrow results by event type, agent, or time range.