
SmartAssist lets a contact center supervisor track the daily tasks and performance metrics of the agents mapped to the selected bot under Agent Desktop > Today.
This section displays the following metrics that help assess agent productivity, efficiency, and total time saved through automation using the activity counts and pie chart depictions.
- Total activities
- Automations
- Agent transfers
- Deflections
- The top use cases
- The hourly activity metrics for automation, deflections, drop-offs, and agent transfers.
- Top bot use cases for Q&As and conversations.
- Automation Savings – Total time and Avg. time/interaction for calls and chats.
The sections displayed in this panel include:
Today’s Stats
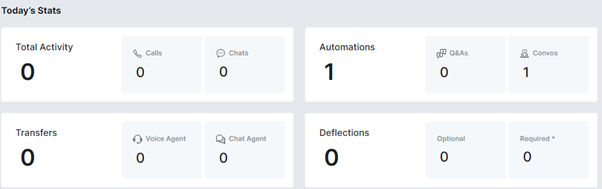
The Today’s Stats panel displays the current day’s data for the following:
- Total activity count and individual counts for the chat and call channels.
- Total number of automations and their distribution for Q&A and Conversation use cases.
- Total call/chat transfers done and the individual counts for voice agent and chat agent transfers.
- Total deflections made for call and chat conversations and the optional (customer-initiated) and required (system-initiated) the deflection counts.
These counters get updated in real-time as customer conversations progress over the current day on SmartAssist.
Activity Pie Charts
The pie chart view of today’s data is displayed in the Today’s Stats section.
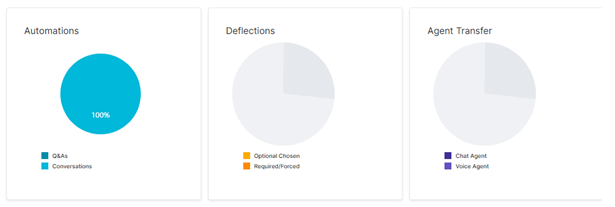
The three pie charts displayed in this section include:
Automations
This chart displays the percentage counts of Q&A and Conversation response automations for a live agent on the current day.
Deflections
This chart displays the percentage counts of optional/chosen vs. required/forced conversational deflections that happened today for the selected bot.
Agent Transfer
This chart displays the chat agents and voice agent comparison percentage counts of the transfers done on the current day.
Activity by Hour

This panel displays the hour-wise total activity count graph for:
- Total Activity: The collective count of all the activities.
- Automation: Counts specific to call and chat automations.
- Deflection: Counts specific to call and chat deflections.
- Drop-offs: Counts specific to the calls and chats dropped off by the customer.
- Agent Transfer: Counts specific to call and chat agent transfers.
Setting the Hours Range

To view the activity by hour graph for a specific start and end hours range, set the same on the Hours range meter and adjust the time from 0 to 24 hours.
Top Use Cases
This section displays the bubble chart for the top conversational use cases, for example, notifications, product enquiries, etc. that have customer Q&As and Conversations.
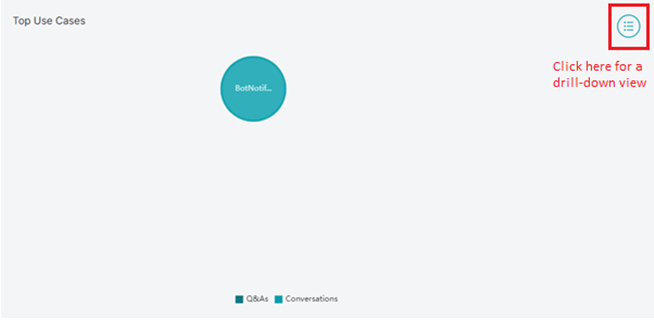
- This activity metric helps the supervisor determine which type of interaction is in high demand among Q&As and Conversations.
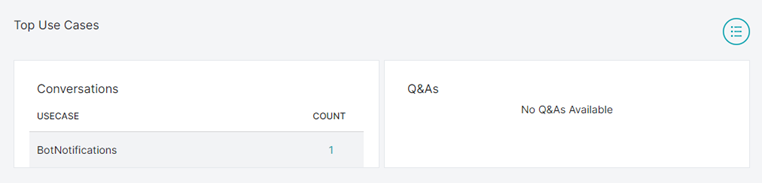
- For the detailed view of the individual Q&As and Conversations counts, click the drill-down icon on the top right.
- The following screen appears where the use case-wise counts for Conversations and Q&As are displayed in two separate panels.

For the selected Bot, the total time and average time per interaction saved through calls and chats automation on the current day are displayed. Automation Savings is an indicator of the benefits of automation in reducing the call and chat cycles.
Total Time
The total time saved in hours and minutes (for calls and chats combined), and that for calls and chats individually through automation are displayed here.
Avg. Time/Interaction
The average time saved per interaction in hours and minutes (for calls and chats combined), and that for calls and chats individually through automation are displayed here.