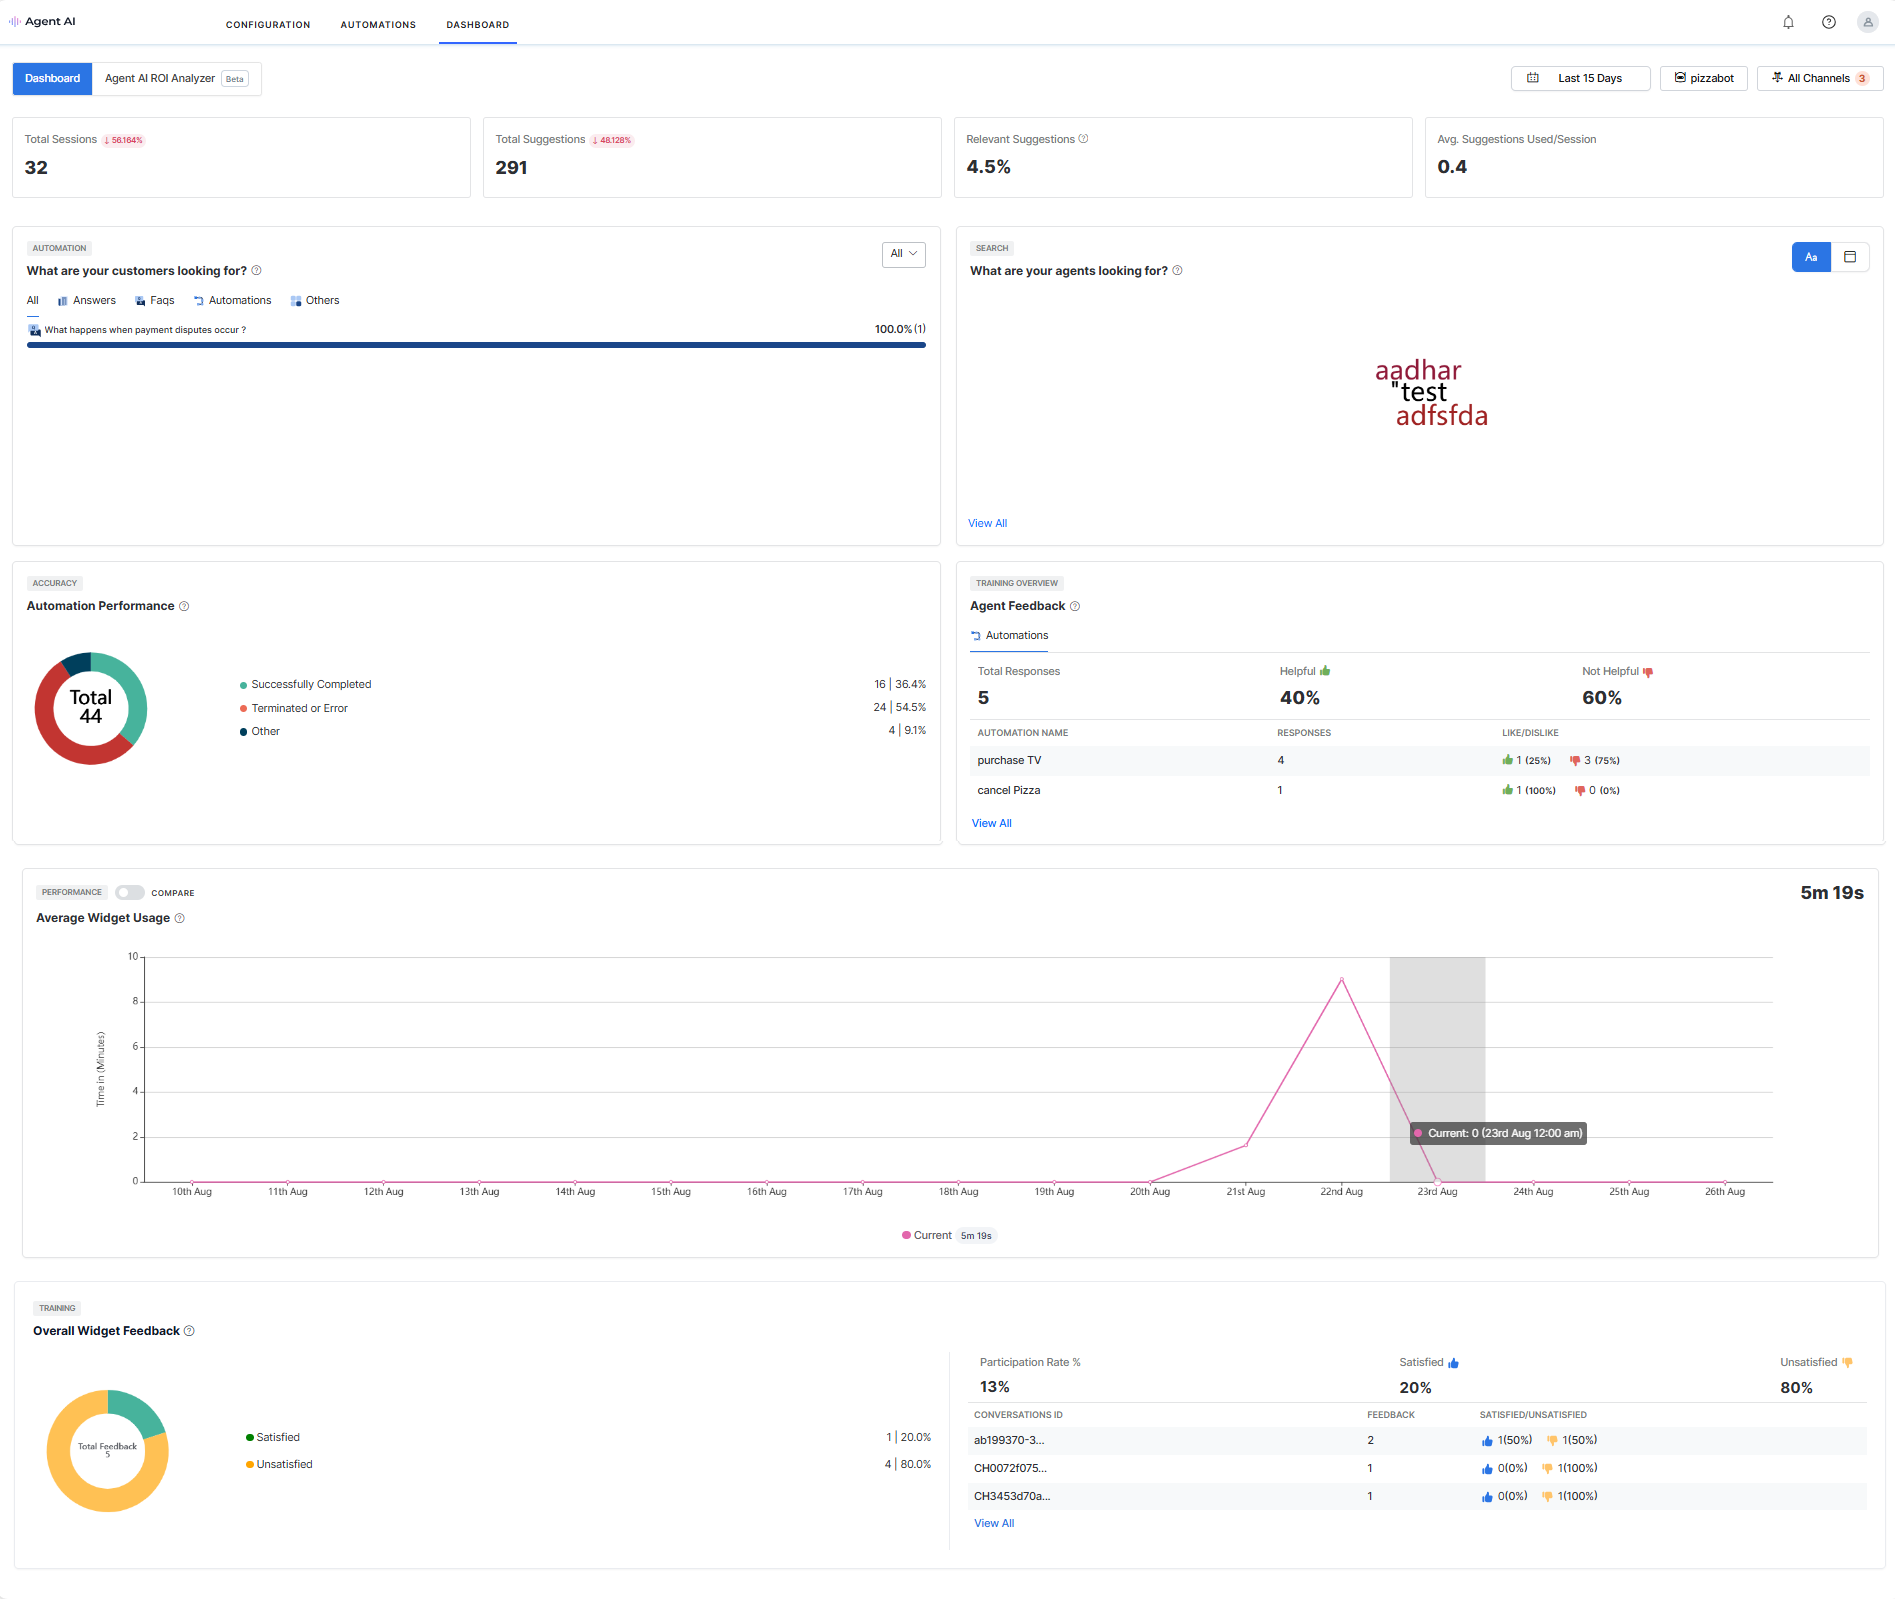
The Agent AI Dashboard displays performance metrics of the Agent AI widget and the behavioral trend of the end users (agents and customers). You can filter data by channel or time period. Metrics include total sessions, widget suggestions, relevant suggestions, average widget suggestions used per session, help content and automation agents used to resolve customer issues, search behavior of agents, automation performance results, agent feedback via likes and dislikes, and the overall widget performance feedback (satisfied and unsatisfied percentage).
To view the Dashboard, sign in to Agent AI, and click Dashboard from the top-left menu.
Dashboard Filters
The Agent AI Dashboard lets you filter the dashboard data over a period of time and of a specific channel.
Filter by Time Period
You can filter data based on a selected time duration. Click the Calendar icon at the top, select one of the options from the list, and then click Apply.
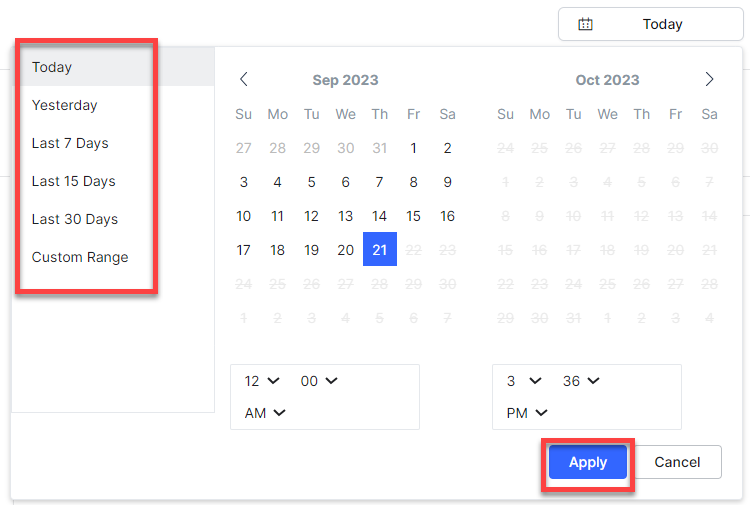
- Today: Default value. It shows data until the present time (minute).
- Yesterday: Data of the previous day.
- Last 7 Days: Data of the last one week.
- Last 15 Days: Data of the last 15 days.
- Last 30 Days: Data of the last 30 days.
- Custom Range: Data of the selected “From” and “To” dates. This duration shouldn’t exceed 60 days.
Filter by Channel
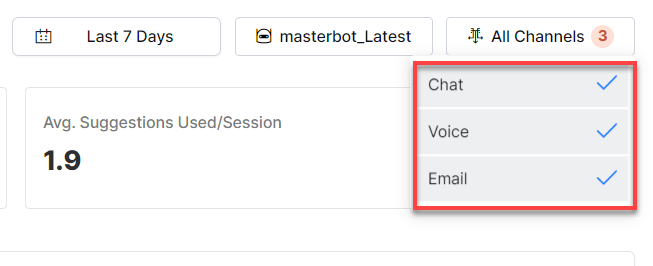
The default setting of the Agent AI Dashboard shows the combined data of all three channels—Voice, Chat, and Email. To filter data by channel, click the All Channels button on the top-right corner, and then click against a channel to select or clear it from the dropdown list.
Data on Widget Performance and Agent or Customer Behavior
This section lets you view and filter the Agent AI Widget’s performance data.
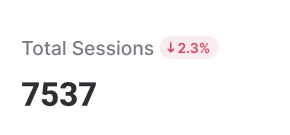
Total Sessions
It indicates the total number of uninterrupted interactions between the bot and the end user (customer or agent) over a selected time period on a selected channel. Each session has been set for 15 minutes. If a session lasts beyond 15 minutes but less than 30 minutes, it gets calculated as two sessions. The red superscripted percentage with an arrow symbol indicates a decrease, and the green one indicates an increase in the percentage of number of sessions over a selected time period over a previous session. For example, a number 532 and a 5.2% with a red downwards arrow implies 532 sessions over the interval shown (say, a week) and a 5.2% decrease over the previous week.
Total Suggestions
It indicates the total number of suggestions from the Agent AI Widget (for example, “ask customer” and “tell customer”) to the agent. These suggestions include answers, automations, and FAQs. The red and green percentages indicate a decrease and increase in numbers, similar to the Total Sessions section.

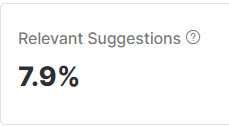
Relevant Suggestions
The percentage of suggestions used by agents. This number is derived by dividing the total suggestions used by agents with the total suggestions, multiplied by 100.
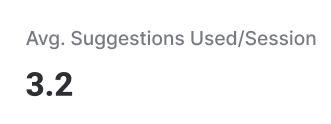
Average Suggestions Used per Session
The average number of suggestions used per each session. This number is derived by dividing the total number of Agent AI Widget suggestions by the number of sessions.
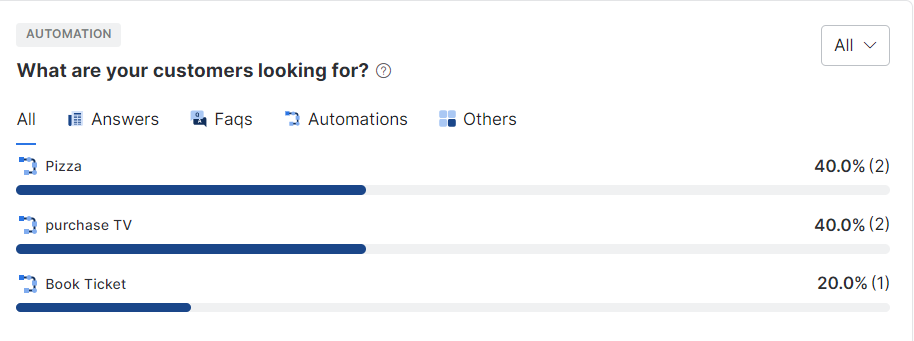
What are Your Customers Looking for
This section shows which Answers, FAQs, Dialogue Tasks, web suggestions, and other data sources are used to fulfill a customer’s needs. This list appears in popularity order–the most used item appears at the top. You can filter data based on values as All, Agent Initiated, and Agent AI Suggested values, with the default selection being All. You have four tabs at the top–All, Answers, FAQs, Automations, and Others–with All being the default tab. Click the respective tabs to view the top four Answers, FAQs, Automations, or others. Each item on the list has a number on its right that indicates the number of times that item has been invoked or used, and the percentage value is the number of times invoked or used divided by the number of times invoked for each tab.
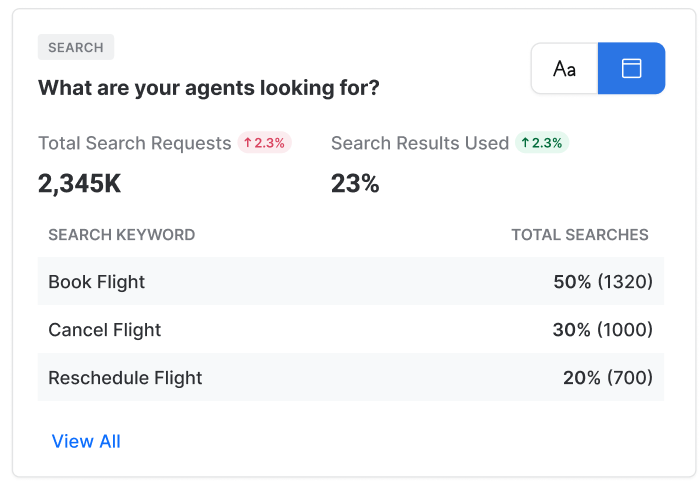
What are your Agents Looking for
This section shows what the agents are searching for. Agent AI gets this data through the Ask a question search box. Every time an agent enters an item in this search box, Agent AI records the data. The Total Search Requests shows the number of times agents have had search requests. The green and red percentage colors with an arrow symbol are similar to the Total Sessions section. By default, the data is displayed in WordCloud, and you can change it to Tabular form.
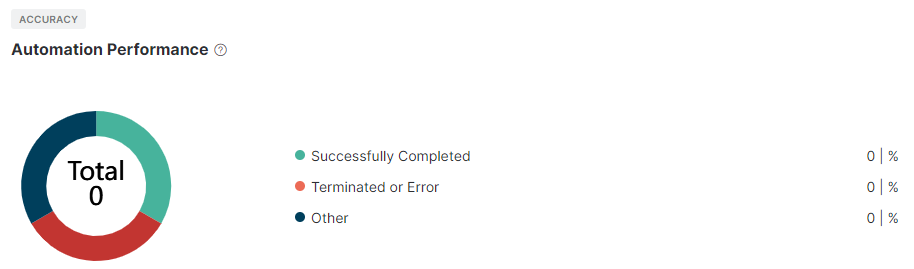
Automation Performance
This section shows the performance results (successfully completed, error encountered, terminated, etc.) of all Agent AI automations. The data is represented on a pie chart. To read the data, use the following pointers:
- The number at the center of the pie chart depicts the total number of all automation invocations.
- The pie chart is divided into three color-coded sections—Successfully Completed (green), Terminated or Error (red), and Other (dark blue).
- Hover over any section of the pie chart to see the top three automations of that result, with invocations percentage over total invocations.
- On the right, you find the total number and percentage out of the sum total for each item.
Agent Feedback
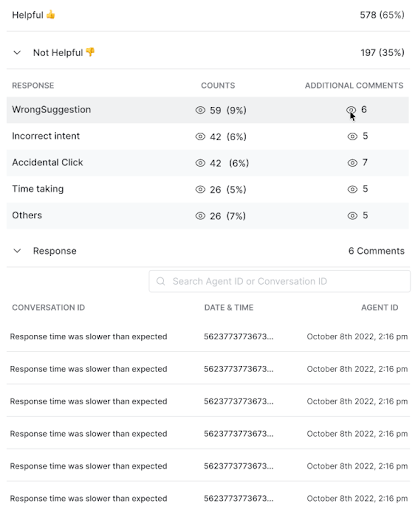
This section shows the top three most disliked automations by agents in descending order of dislike percentage. Agent AI gets this data by capturing the likes or dislikes at the end of a dialog task. You can have a detailed summary of Agent Feedback for dialog tasks, including “Not Helpful” feedback and Additional Comments. The detailed view of the “Not Helpful” feedback includes Responses, Additional Comments, and Counts. You must click View All to view further details of a dialog task.
- Click a dialog task under Automation Name.
- Click the “eye-like” icon under Additional Comments to access all comments linked to their conversation IDs.
- Click the Conversation ID link to go to the respective conversation.
- Click the Counts number to access the Conversation ID, Date, Time, and Agent Name/ID.
- Use the “search” button to find conversations by agent name, agent ID, or conversation ID.
- If the agent’s name is provided, the agent column appears for searching; otherwise, the conversation ID is available.
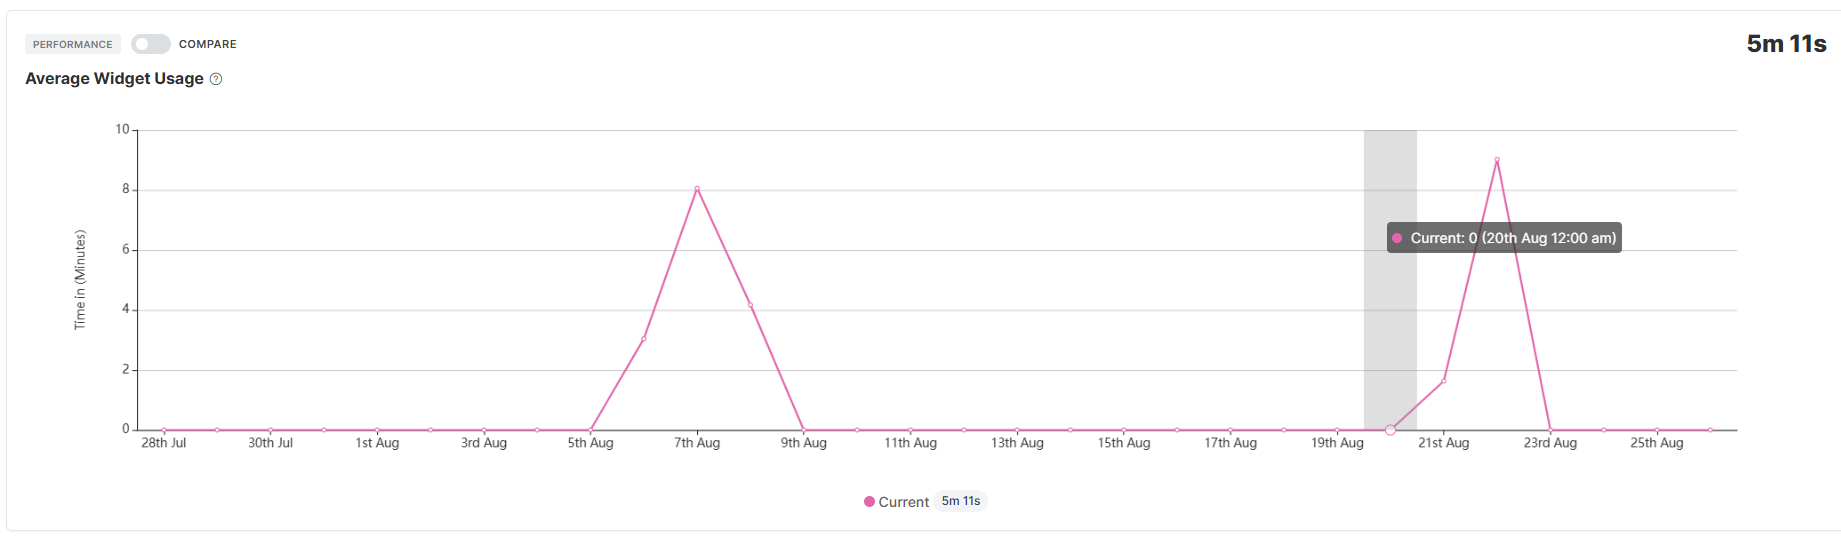
Average Widget Usage (Third-Party Agent Desktop)
This feature gives a graphical representation of the average amount of time agents spend on the Agent AI widget and is applicable only for the third-party agent desktops. You can use the Compare button to compare the data you have selected for a time period in an “n-1” formula. For example, if you have selected “30 days,” last 30 days’ data is compared with the previous 30 days’ data.
Overall Widget Feedback
The Overall Widget Feedback section provides a summary of agent feedback on the Agent AI widget. It shows the Total Feedback, Participation Rate percentage, and the Satisfied versus Unsatisfied feedback percentage. At the individual conversation level, it provides details such as agent names, feedback reasons, comments, and conversation transcripts. This information helps administrators monitor agent experience, track areas where the widget performs well, and prioritize improvements to enhance usability and effectiveness.
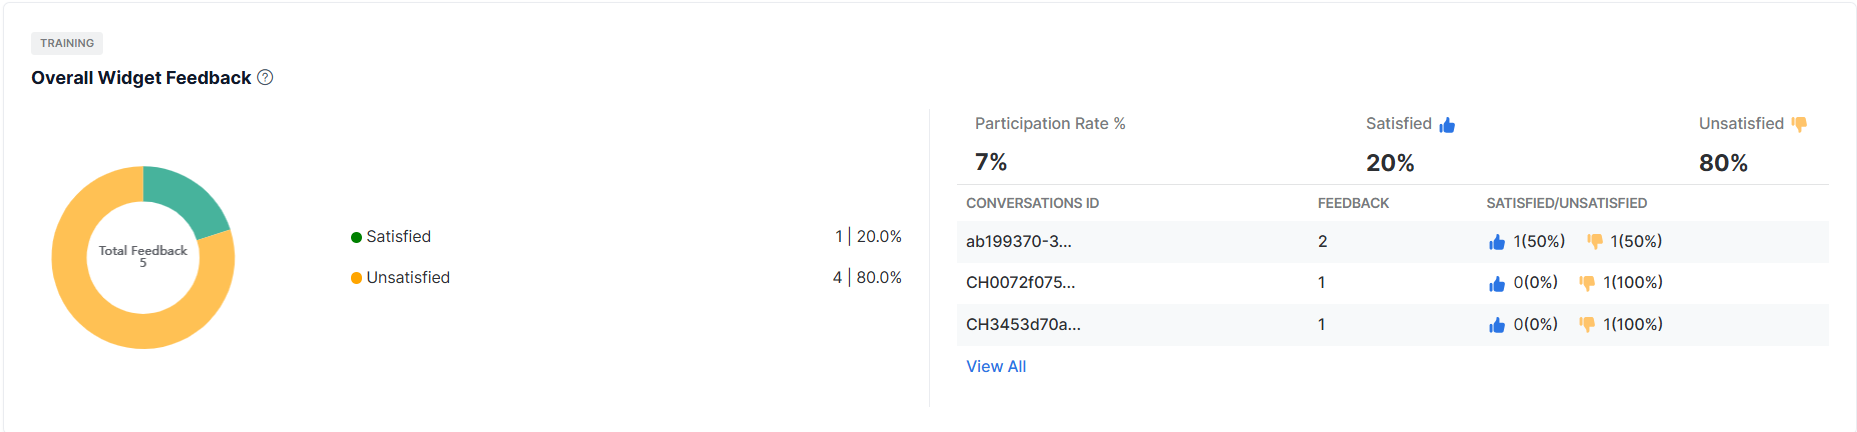
In the above screenshot:
- The first section on the left shows the total number of agent feedback responses for the selected time period, along with the number and percentage of satisfied and unsatisfied feedback. Hovering over the color-coded chart (yellow for unsatisfied and green for satisfied) displays the same details. The percentages are calculated using the following formulas:
- Unsatisfied (%) = (Total unsatisfied feedback ÷ Total feedback) × 100
- Satisfied (%) = (Total satisfied feedback ÷ Total feedback) × 100
- The second section on the top-right shows the Participation Rate, Satisfied, and Unsatisfied percentages. Note that you must count multiple feedback entries for a conversation as one while calculating the Participation Rate percentage. The formula is:
- Participation Rate (%) = (Conversations with feedback ÷ Total conversations) x 100
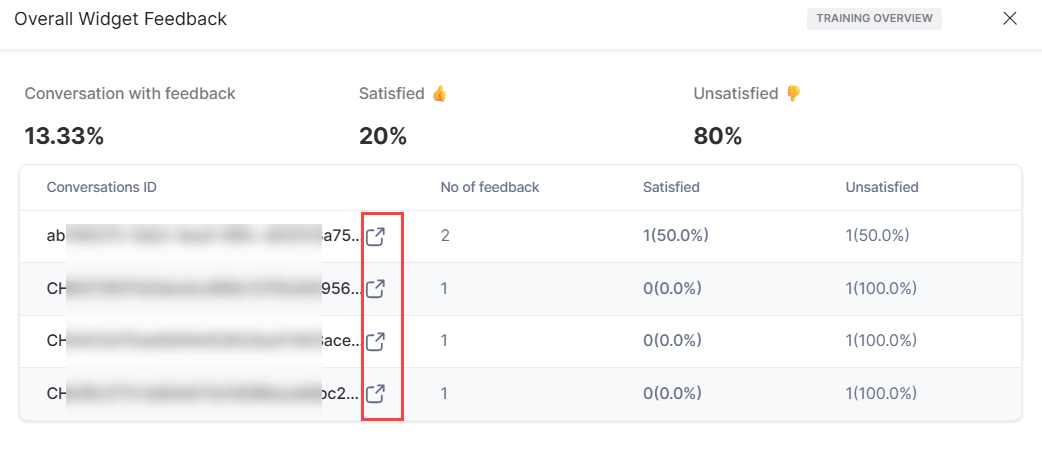
- The third section shows conversation IDs, the number of agent feedback responses, and the percentage of satisfied and unsatisfied feedback for each conversation.
- To view the details of a conversation, click the external link icon next to a conversation ID.

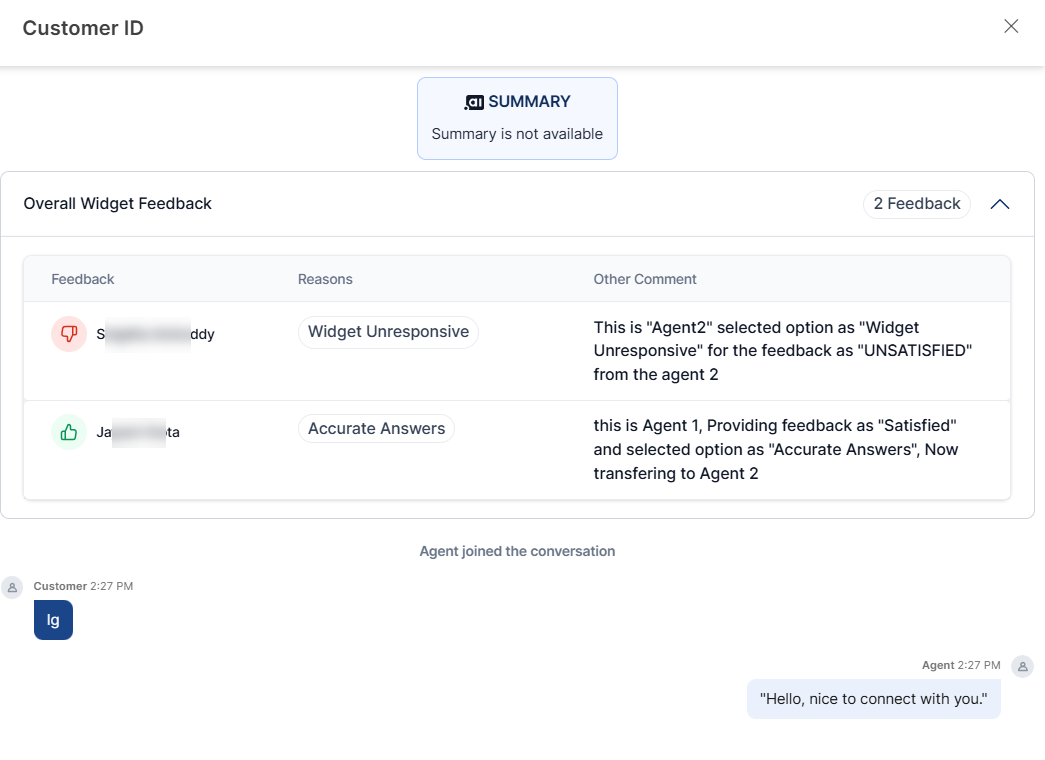
- Details such as agent name, selected feedback reason, and added comments display along with the actual conversation:
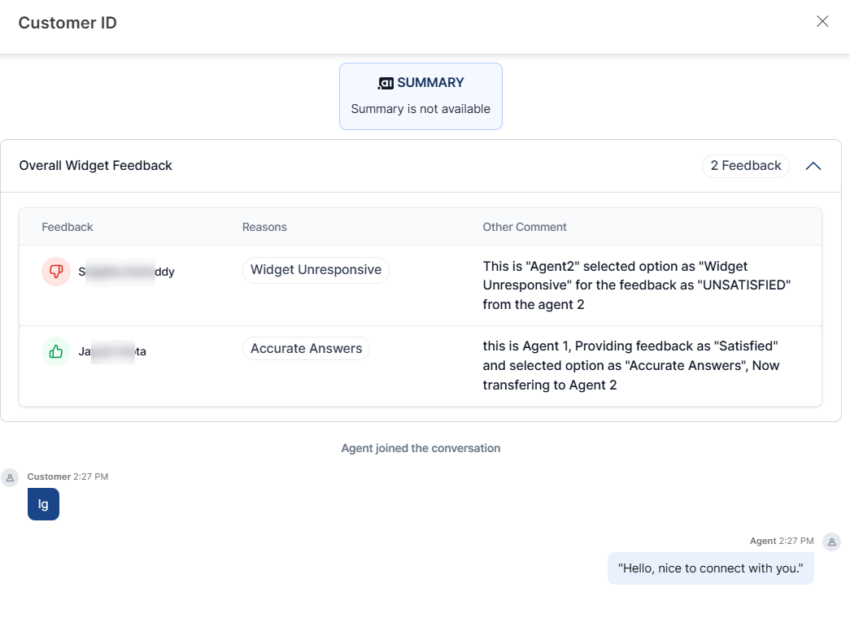
- To view the details of a conversation, click the external link icon next to a conversation ID.