Run Agent Flows
You can run and test a flow to see how it works in real time. When you run a flow, it generates a context object and stores it temporarily at the node level, allowing you to monitor progress through the debug log.
The output includes key information such as the start and end times, the total time to run the flow, and any unresolved issues or errors that may have occurred during execution.
Steps to run the flow:
-
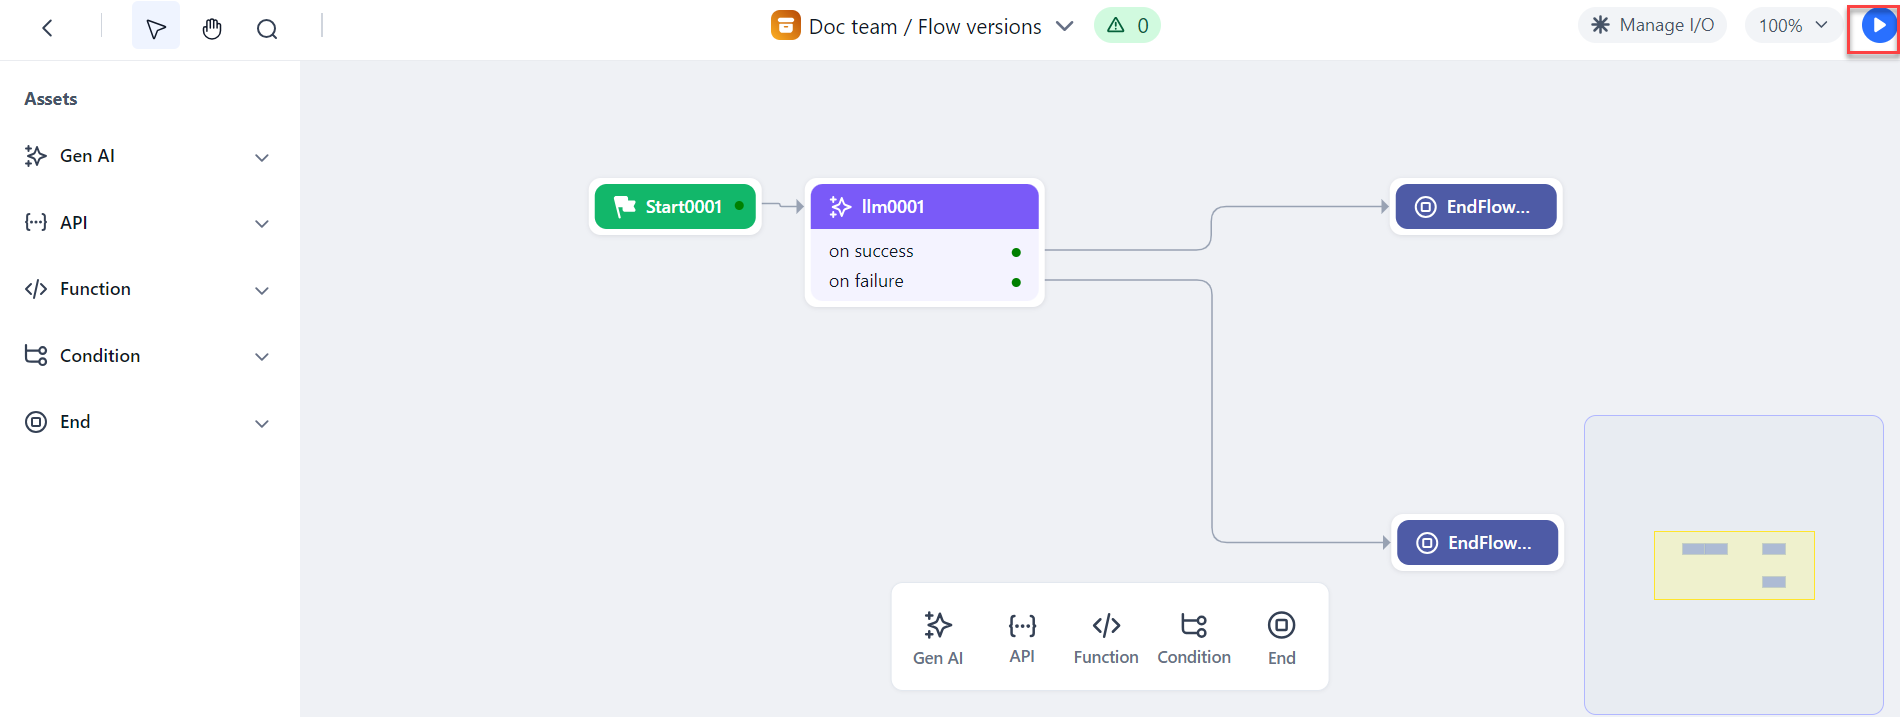
On the top right corner of the agent canvas, click the Run flow icon.
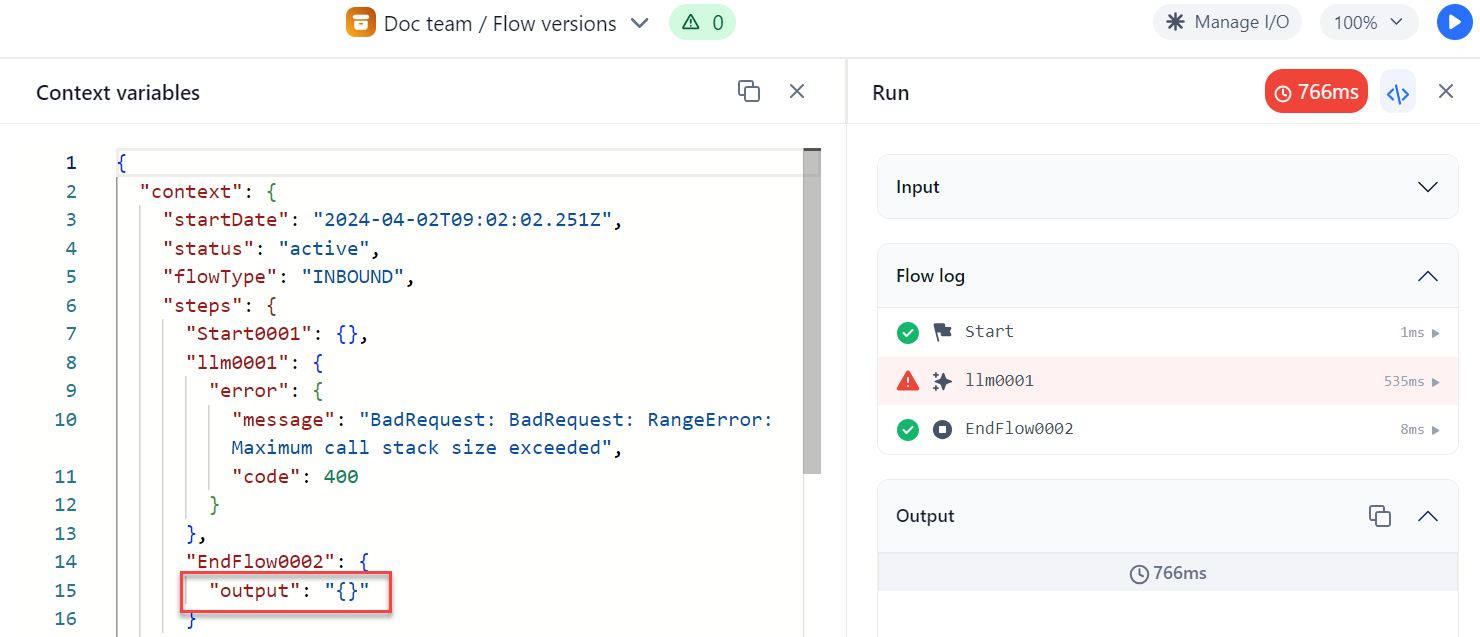
The Run dialog opens, displaying the Input, Flow log, and Output sections.
-
On the top of the Run dialog, click the Debug icon to open the Debug log.
The debug log starts showing the output results as the flow executes. -
View flow success or failure:
- Successful Flow: If the flow completes successfully, you can copy the output results using the Copy icon. The overall runtime flow, showing the total execution time, is also displayed for reference.
- Flow Errors: If errors occur, an error message will be displayed. Additionally, the output key will appear empty, and the output will be shown in JSON format, indicating a failure within the flow.
Note
You can stop the flow at any point during the execution and restart it by clicking the Run flow icon again.
Debug Log Overview
The debug log lets you monitor the flow’s execution and track output results, helping you troubleshoot performance issues. It captures detailed information about each step in a flow, including inputs, execution status, errors, and timing.
The debug log shows the following key details:
- Flow input values: View the values you entered for the input variables when setting up the flow.
- Flow-level log details: Get an overview of logs at the flow level, including initiation and progress.
- Node-level information: For each flow initiation, detailed logs are provided for each node, which include the success or failure status.
- Node success/failure links: Links to additional details if a node succeeds or fails.
- Tool calling details: Provides detailed logs of any tools called during the agent flow's execution (available only for Gen AI nodes). It records when tools are triggered, the inputs passed to them (JSON), responses or results received, and any errors that occurred during tool calling. A separate panel shows detailed tool traces, including step-by-step logs of each tool’s execution. This helps track the performance and usage of the tools in the flow.
- Node metrics: For each node, the following metrics are available:
- Initiated On: The timestamp for when the node was triggered.
- Executed On: The timestamp for when the node execution was completed.
- Total Time Taken: The time it took for the node to complete execution.
- Tokens: The token usage during execution (available only for Gen AI nodes).
Time Metrics for API and Gen AI Nodes
The debug log contains detailed API and Gen AI node time metrics. These metrics, available during both design time and run time, show how long each node takes to execute, including time spent processing and waiting for external API or AI responses. These metrics help you optimize flow performance by identifying bottlenecks in both internal processing and external service calls.
Time Breakdown for API Nodes
API nodes can be configured in either synchronous or asynchronous mode:
Synchronous Mode: When an API node is configured in synchronous mode, the total time taken for execution is split into two key components:
- Node processing time: The time taken by the node to complete the execution.
- API Response time: The time spent waiting for a response from the external API.
Asynchronous Mode: For asynchronous API nodes, the flow pauses while waiting for the API response, and the following metrics are provided in the log:
- Node paused at: The timestamp when the node paused waiting for the asynchronous response.
- Node resumed at: The timestamp is when the node resumes after receiving the response.
- Total wait time: The total duration between the node pausing and resuming, indicating the time spent waiting for the API.
- Node processing time: The time GALE spends processing the node after it resumes from the pause.
Time Breakdown for Gen AI Nodes
Similar to API nodes, Gen AI nodes also involve external service calls (for example, to AI models). For Gen AI nodes, the following two key timing metrics are shown in the debug log:
- Node processing time: The time taken by the node to complete the execution.
- LLM response time: The time taken for the connected AI model to return a response to GALE's Gen AI node.

