

Key Capabilities
Access the Agent-specific Dashboard
A supervisor can access the Agent Dashboard in the following ways: Option 1:-
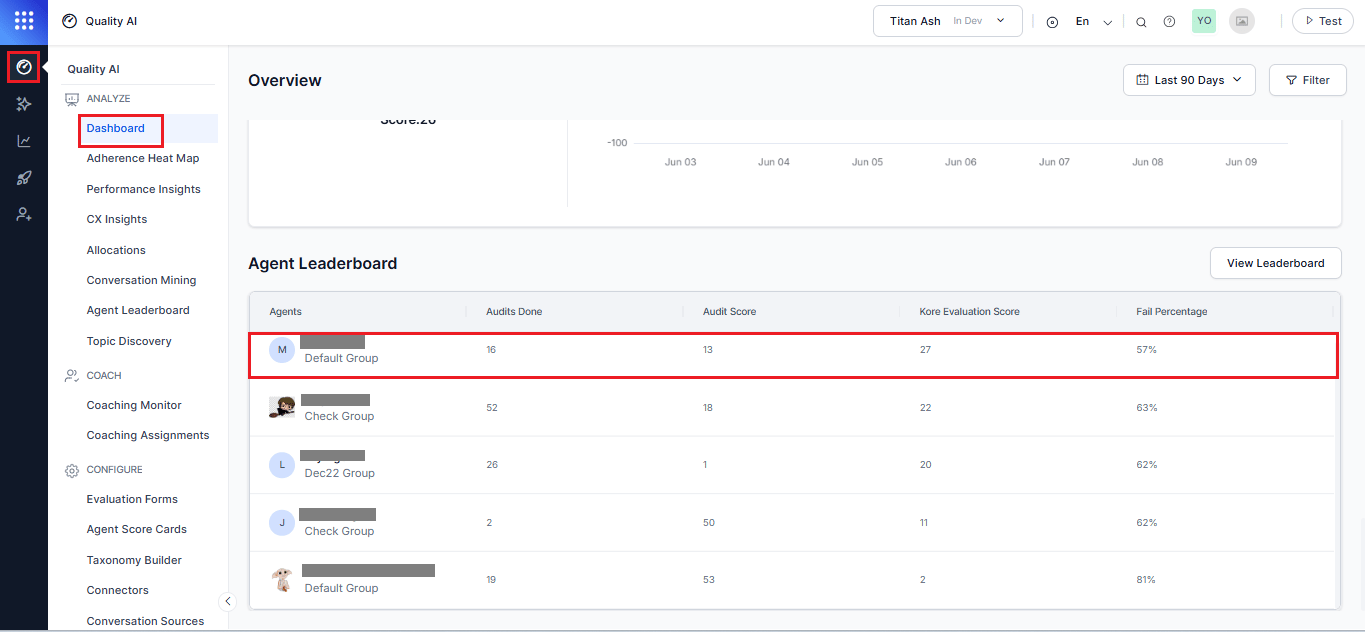
Navigate to Quality AI > Dashboard.
-
In the Agent Leaderboard, select an agent to open the agent-specific dashboard.
-
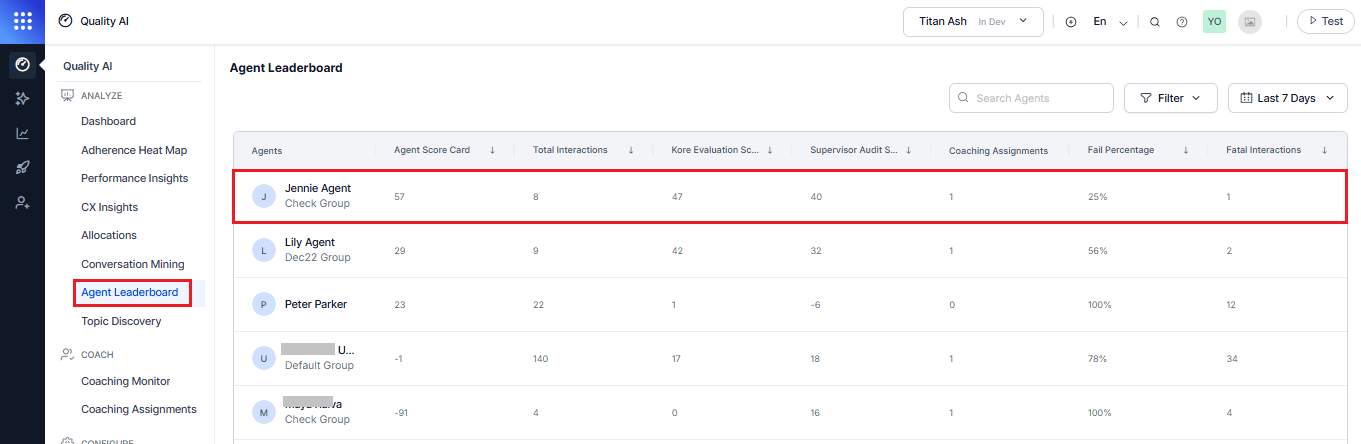
Navigate to Quality AI > Agent Leaderboard.
-
In the Agent Leaderboard, select an agent to open the agent-specific dashboard.
Enable Auto QA, Agent Scorecard, and Agent Access to Scored Interactions, and Agent Accept & Dispute in Quality AI Settings to view evaluation scores and coaching insights, review status, and dispute activity.
Dashboard Tabs
The Agent-Specific Dashboard contains the following tabs:
All dashboard widgets update dynamically based on selected filters.
Filters
The Dashboard metrics helps you Use the dashboard filters to refine the data displayed across all widgets and charts.Agent Performance Metrics
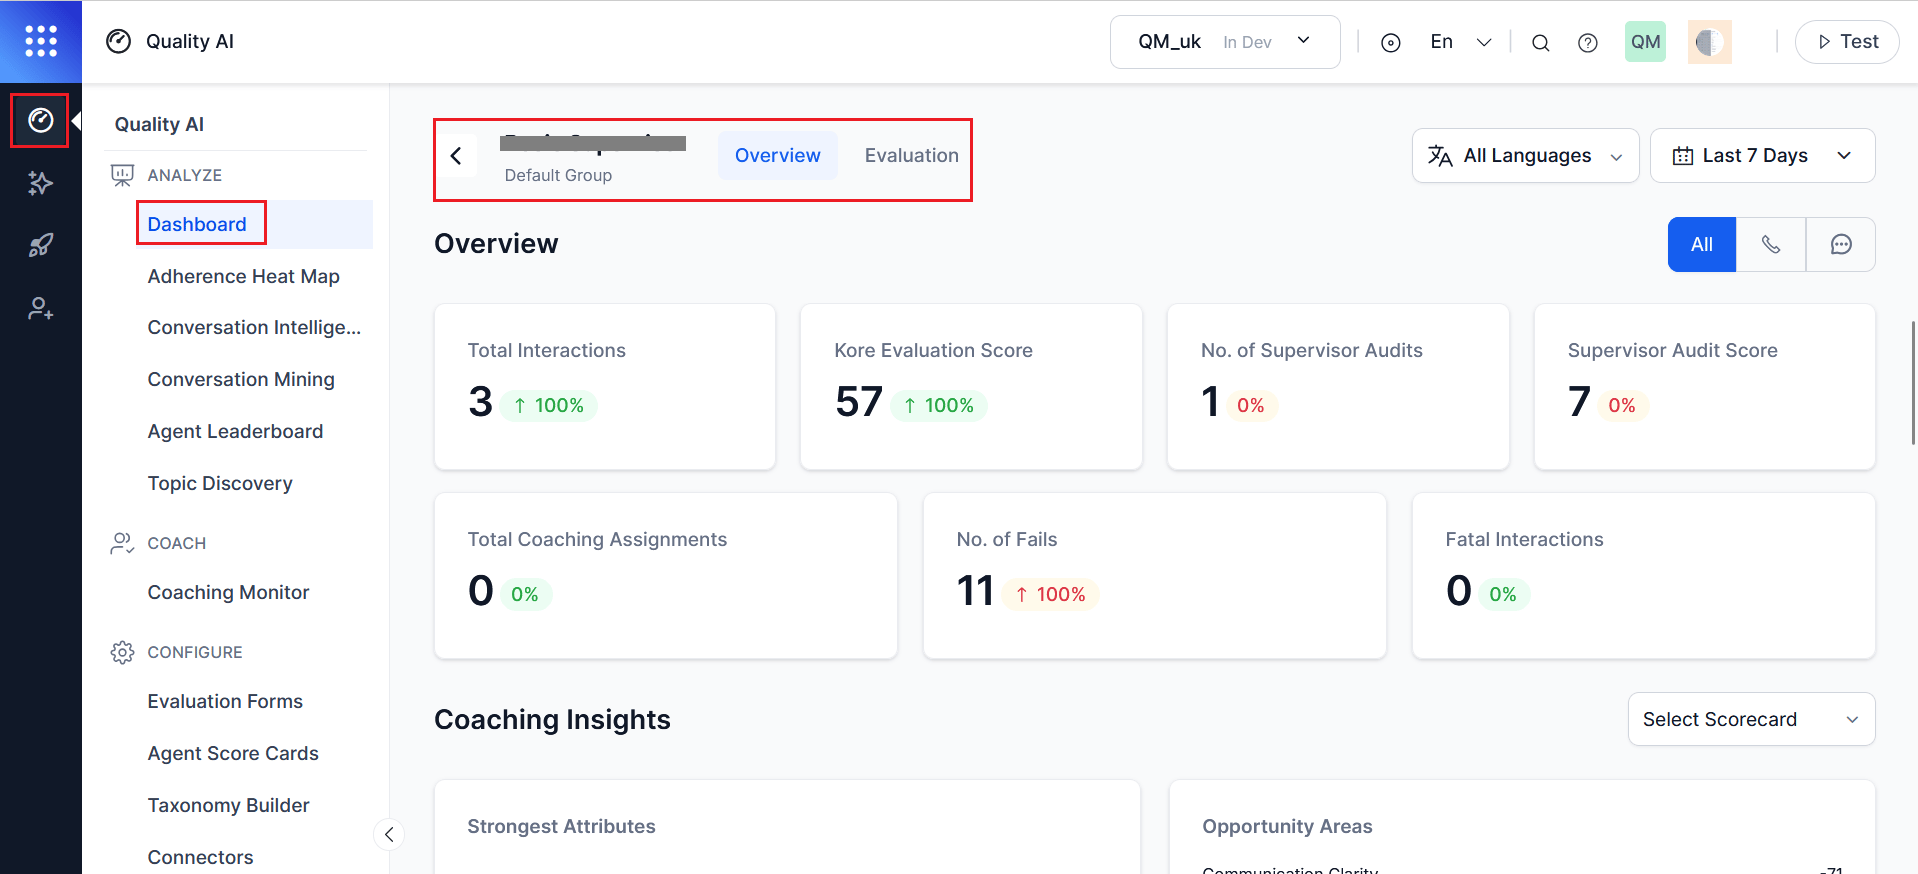
Provides a summary of agent activity and quality performance of the selected date range. Each metric displays the current value and trend change compared to the previous reporting period. For interaction-level evaluation details, see AI-Assisted Manual Audit.
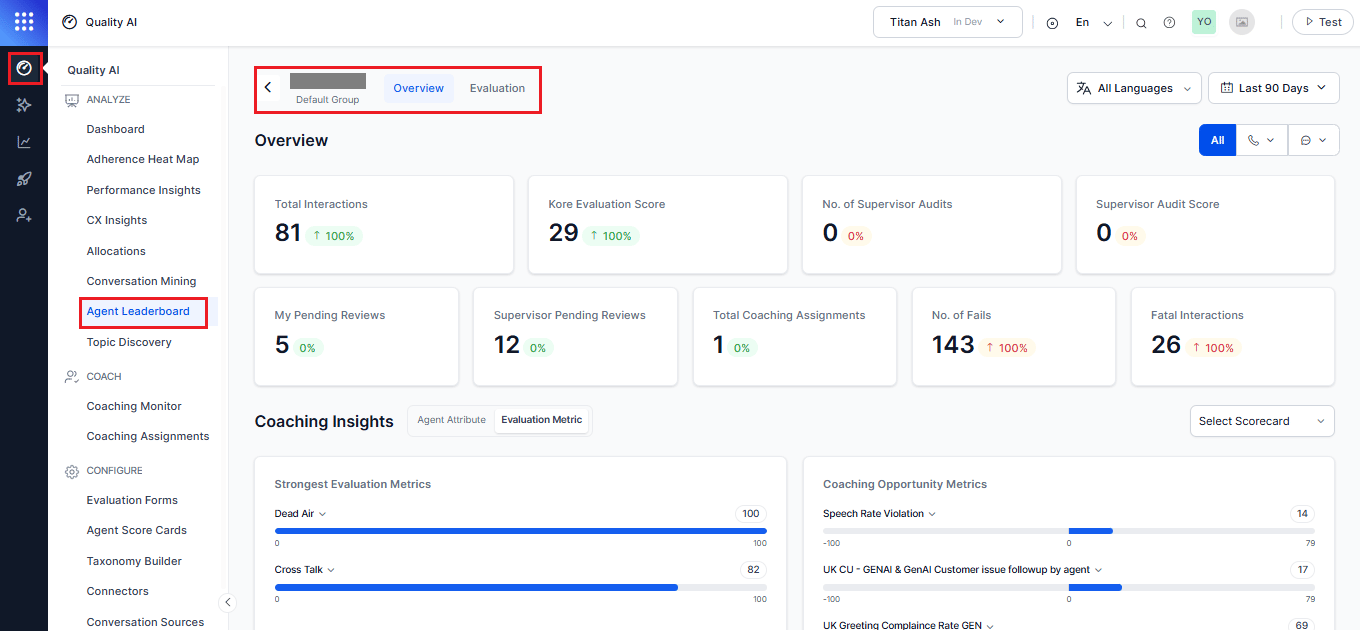
Coaching Insights
This section highlights the agent’s strengths and improvement areas based on evaluation and scorecard results, using score-based visual indicators. It supports two selectable tabs.Select Scorecard
Use the Select Scorecard menu to filter insights for a specific scorecard. All data in both tabs updates based on the selected scorecard and time range.Agent Attribute
This view summarizes performance at the attribute level and contains two sections.Attribute Bar Details
Select an attribute to view the underlying evaluation metrics contributing to the score.Click-through (Attribute to Metric Breakdown)
Select an attribute to open a detailed modal view with metric-level breakdown.Evaluation Metric
This tab displays performance metrics based on the evaluation forms assigned to the agent at the queue level.Hover Insight (Metric — Attribute Mapping)
Hover over a metric to view its mapped agent attribute. For example, hovering over Authentication displays the related attribute, helping supervisors trace metrics to parent attributes without switching tabs or views.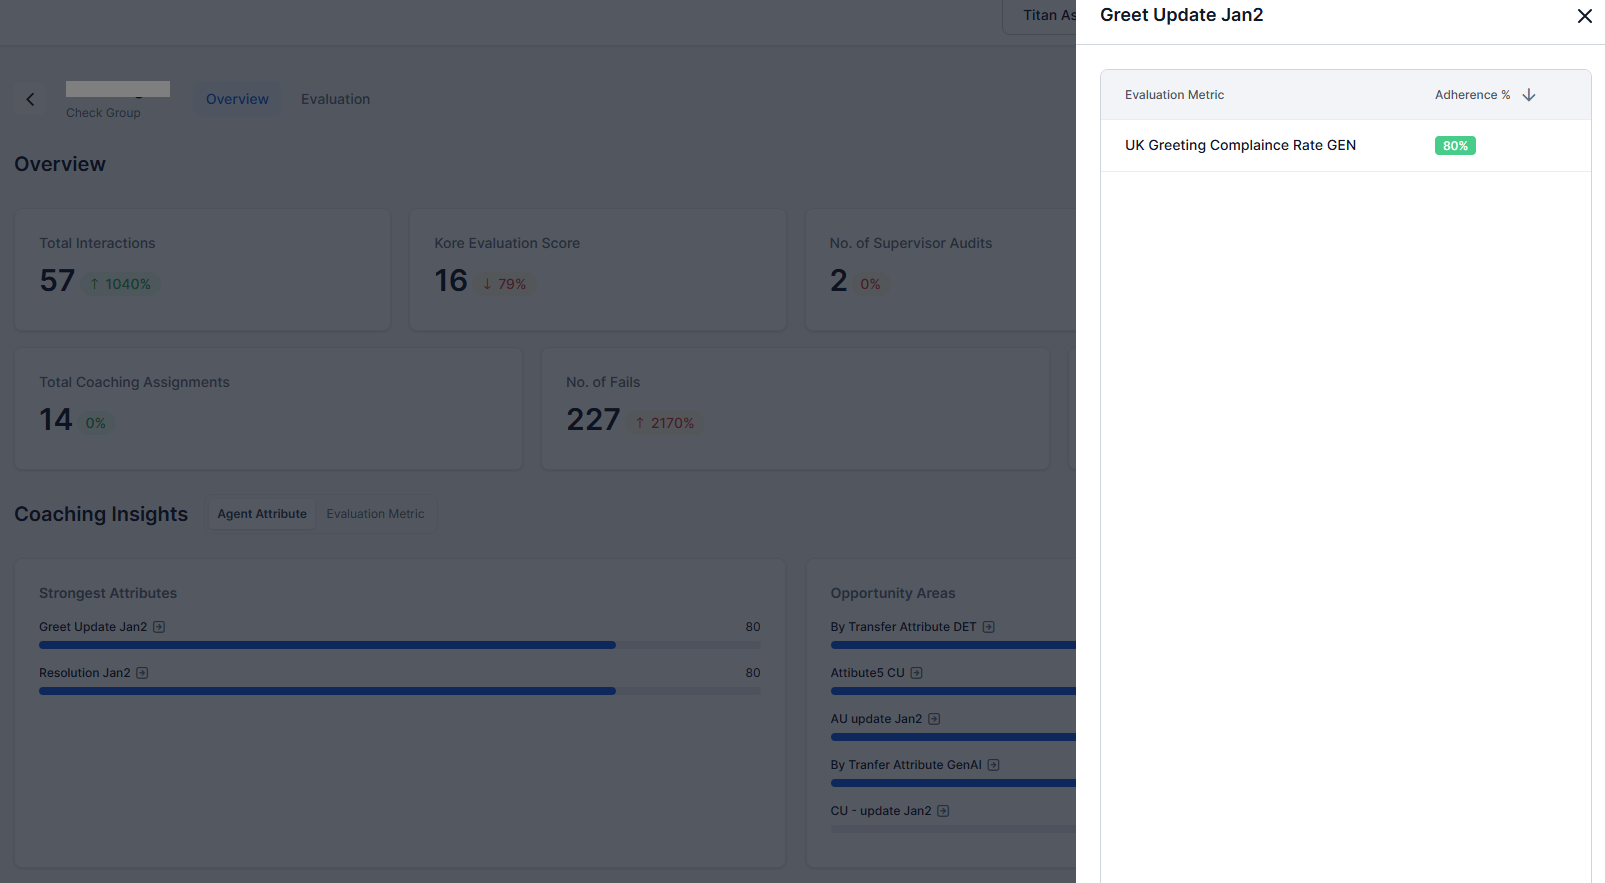
Sentiment Insights
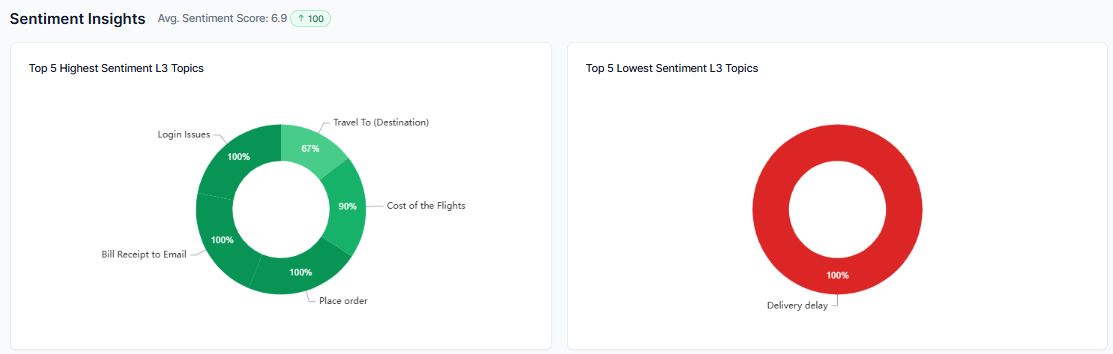
The Sentiment Insights section helps supervisors understand customer sentiment trends associated with the selected agent.- Average Sentiment Score: Displays the agent’s overall sentiment across all topics, including positive and negative conversation counts, along with trend indicators.
- Top Five Highest Sentiment L3 Topics: Displays the top five L3 topics with the highest sentiment scores.
- Top Five Lowest Sentiment L3 Topics: Displays the top five L3 topics with the lowest-sentiment scores.
-
Hover Insights: Hovering over a doughnut chart segment displays the topic name, sentiment percentage, conversation count, and quick links.
- View All Topics: Opens the Topic Discovery page with relevant filters pre-applied.
- View Conversations: Opens the Conversation Mining page to review related conversations.
- Performance Analysis: Displays the topic-level counts, sentiment splits, and insights when you hover over the doughnut chart.
- Color-Coded Patterns: Displays the visual patterns (green = positive, red = negative) for instant understanding of customer mood.
- Identify Performance Gaps: Provides a comparison view to identify the highest and the lowest sentiment.
- Spot Coaching Opportunities: Enables you to make informed decisions based on negative sentiment drivers or recurring customer frustrations.
-
Monitor Trends: Displays track agent sentiment patterns in conversation.
Resolution Insights
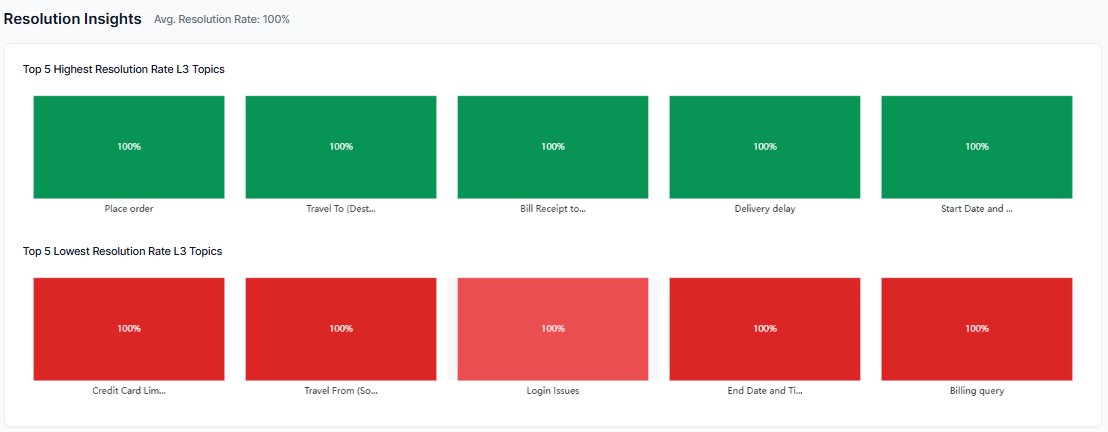
Resolution Insights helps supervisors evaluate how well agents resolve customer issues by displaying resolution trends across L3 topics.- Average Resolution Rate: Displays the agent’s overall average resolution rate across all conversations and topics.
- Top Five Highest-Resolution L3 Topics: Displays the five L3 topics with the highest resolution rates.
- Top Five Lowest-Resolution L3 Topics: Displays the five L3 topics with the lowest resolution rates.
- Resolved or Unresolved Breakdown: Displays conversation counts and percentages for resolved and unresolved conversations for each topic.
-
Hover Insights: Hovering over a chart segment displays topic details, resolution percentage, conversation count, and navigation links.
- View All Topics: Opens the Topic Discovery page with relevant filters pre-applied.
- View Conversations: Opens the Conversation Mining page filtered to the exact topic selected.
- Identify Performance Gaps: Displays a comparison of the highest vs. the lowest resolution rates.
- Color-Coded Patterns: Displays the visual patterns (green = high or successful resolution rates, red = low resolution or unresolved interactions).
-
Performance Analysis: Highlights resolution gaps and coaching opportunities across topics.
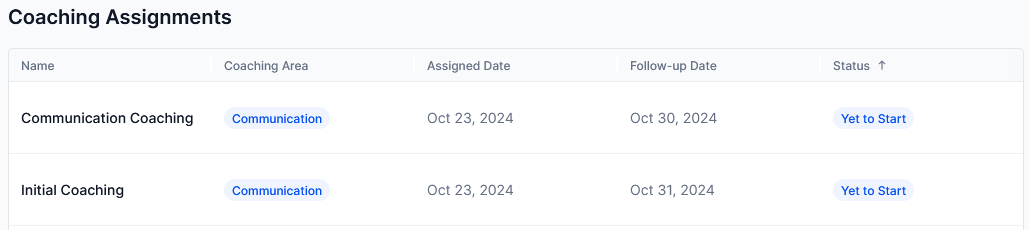
Coaching Assignments
Displays all coaching assignments given to an agent. It enables supervisors to track scorecard performance trends over time and assess improvement or decline.
Status values
Use this section to track coaching progress and follow-ups. For more information, see Coaching Assignments.
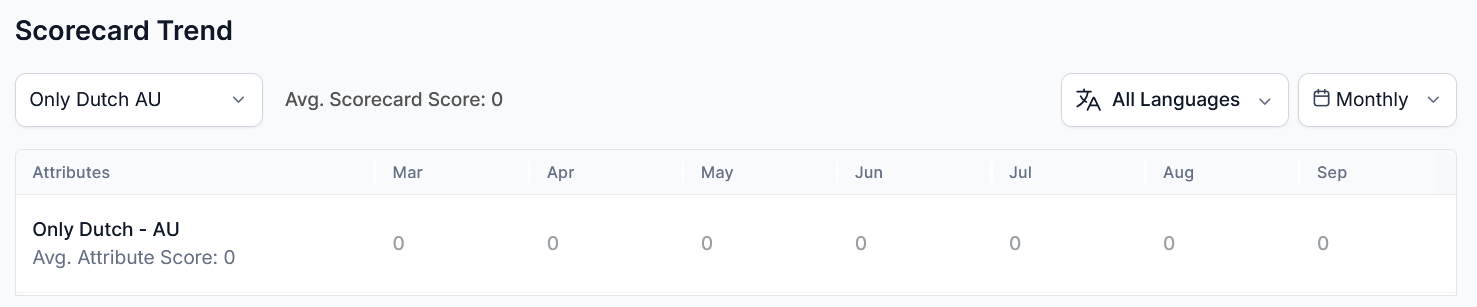
Scorecard Trend
This feature tracks agent performance across assigned scorecards through daily, weekly, and monthly trends. It supports attribute-level analysis, multilingual scorecard views, and targeted coaching insights.Language Configuration
Access & Availability
Avg. Scorecard Score
From the agent side, the scorecard trend widget displays the average scorecard for the selected time range and the scoring trend at an attribute level across the scorecards. When you select a scorecard, the system shows the agent’s average score for the selected global date range. If the system calculates the score after assignment, it doesn’t show any score for that agent. If conversations exist, the scorecard shows in the Scorecard Trends dropdown.Attributes
Shows all agent attributes included in the scorecard along with the average score for each attribute within the selected date range.Handling Flagged Interactions
The Agent Dashboard handles contacts marked Below Threshold or Duration Unavailable as follows:- Excludes flagged contacts from all metric aggregates, coaching insights, and score calculations by default.
- Includes manually evaluated flagged contacts in metrics as normal.
- All dashboard widgets exclude these contacts from both numerator and denominator calculations.