Key Capabilities
Access Adherence Heatmap
Navigate to Quality AI > AutoQA > Adherence Heatmap. Select one or more evaluation forms from the dropdown to view adherence metrics. The Queues filter populates dynamically based on the selected evaluation forms.
Turn on Auto QA in Settings > Quality AI General Settings to use this feature.
Adherence Analysis and Metric Behavior
Adherence Percentage Calculation
The system calculates adherence using only evaluated interactions that are eligible for aggregation, based on the selected evaluation form, agent, and date range.Formula
Handling Flagged Interactions
By default, the system excludes interactions marked Below Threshold or Duration Unavailable from adherence metrics and dashboard aggregates unless you manually evaluate them. After manual evaluation, the system includes these interactions in heatmap calculations and treats them as standard evaluated interactions. An interaction may fall below the threshold for one scorecard but remain eligible for another depending on scorecard-specific duration rules. Duration checks don’t block ingestion, transcript storage, or Conversation Mining access. Flagged interactions remain available in Conversation Mining through the Duration Status filter (All, Evaluated Only, Below Threshold, and Duration Unavailable). The system also displays exclusion reasons and supports drill-through behavior in interaction details.Interaction Eligibility Rules
Metric Applicability
Color Coding
Each heatmap tile is color-coded by adherence percentage. Red indicates 0% adherence, green indicates 100% adherence, and intermediate values display in 10% increments between red and green. The system displays gray when no eligible evaluated interactions match the selected filters.Failed and Fatal Interactions
Hover Tooltip
Hover over a tile to view the adherence percentage, adhered interactions, and total applicable interactions for the selected metric and date. The tooltip excludes Below Threshold and Duration Unavailable (flagged) interactions unless they’re manually evaluated.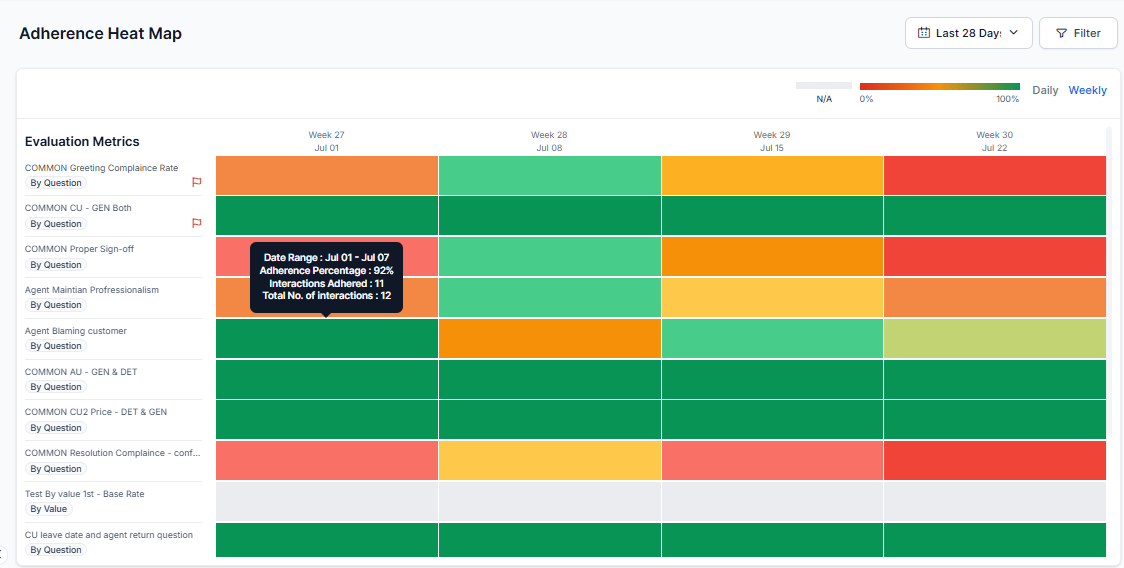
Filters
The Adherence Heatmap organizes filters into shared filters that apply to all conversations and conversation-type-specific filters for Human Agent and AI Agent conversations. Use these filters to refine adherence data by evaluation form, queue, channel, interaction direction, agent, and language.Select an evaluation form before selecting a queue. The available language options depend on the selected evaluation form.
Heatmap Interactions
Adherence Heatmap Overview
The Adherence Heatmap displays adherence for evaluation metrics across the selected date range. The heatmap updates based on the selected filters, such as Evaluation Form, Queue, Channel, Interaction Direction, Agent, and Language. Each tile represents the adherence result for a specific evaluation metric during a selected date range. The heatmap uses color-coded tiles to represent adherence percentages for each evaluation metric and date range.- Green indicates higher adherence.
- Yellow/Orange indicates moderate adherence.
- Red indicates lower adherence.
- Gray (N/A) indicates that no eligible interactions are available for the selected period.
Heatmap Tile Details
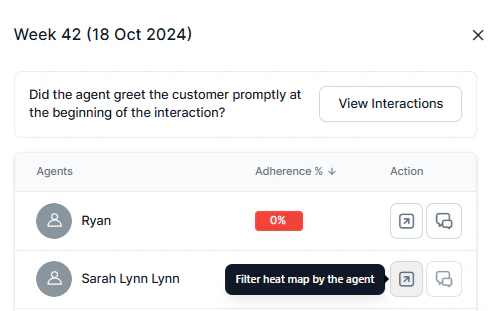
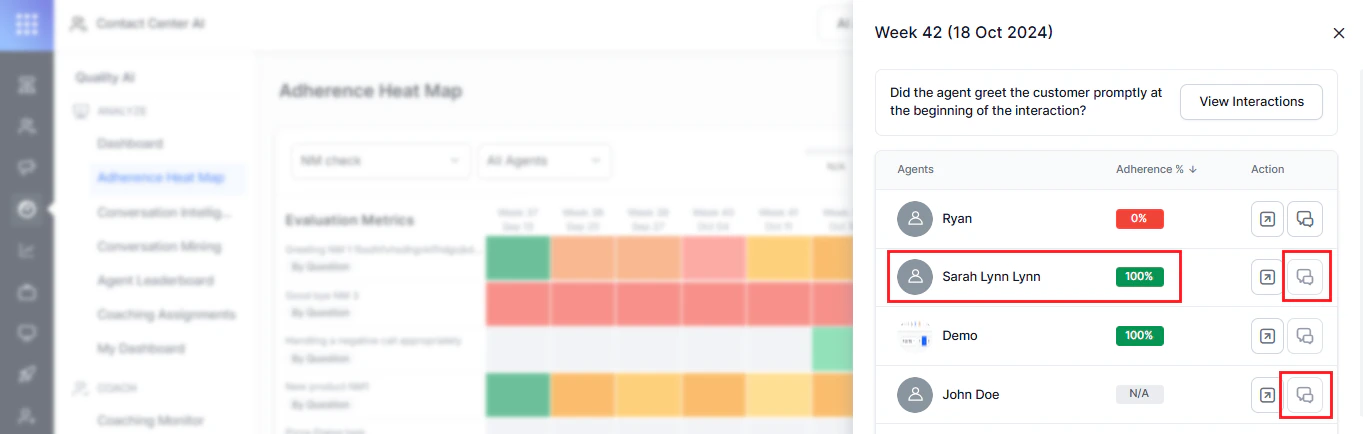
Hover over a heatmap tile to view the evaluation metric, date range, adherence percentage, and total number of interactions. Select a tile to open the Agent-Level Breakdown for the selected evaluation metric and date range.Agent-Level Breakdown
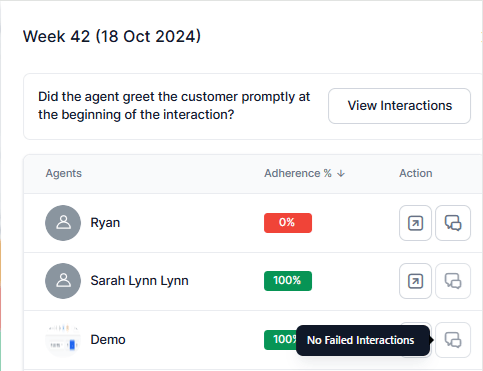
The Agent-Level Breakdown displays each agent’s adherence percentage for the selected evaluation metric and date range. From this panel, you can:- View Interactions to open Conversation Mining with filters applied for the selected agent, evaluation metric, and date range.
- Filter by Agent to display the selected agent’s adherence results in the heatmap.
View Interactions
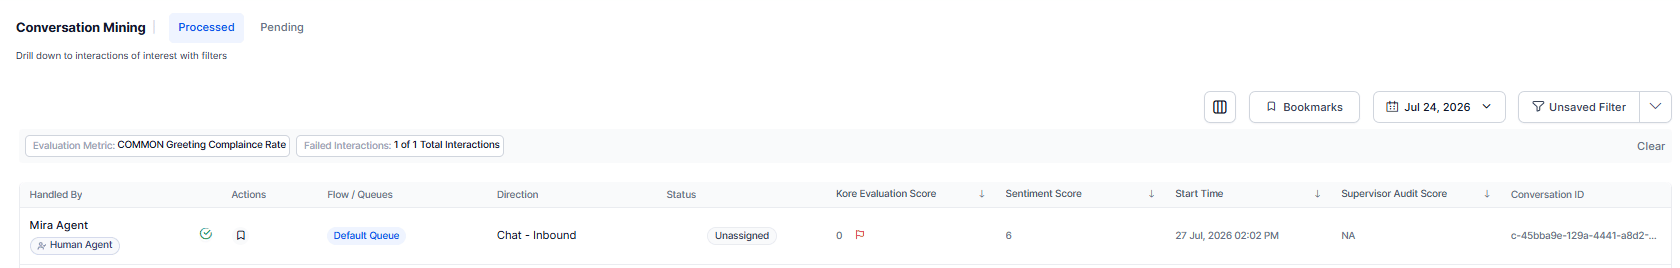
When you select View Interactions, the system opens Conversation Mining, and the system:- Opens the Processed interactions view.
- Applies the selected evaluation metric as an Unsaved Filter.
- Displays interactions that match the selected metric and applied filters.
Interaction Display Behavior
Agents with no applicable interactions display at the bottom of the list.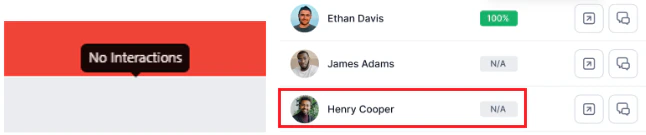
Action Filters