

Access Performance
- Sign in to AI for Service.
- Go to Agent AI > Analytics.
- Select Agent AI > Performance.
- Filter data based on date and channel type:
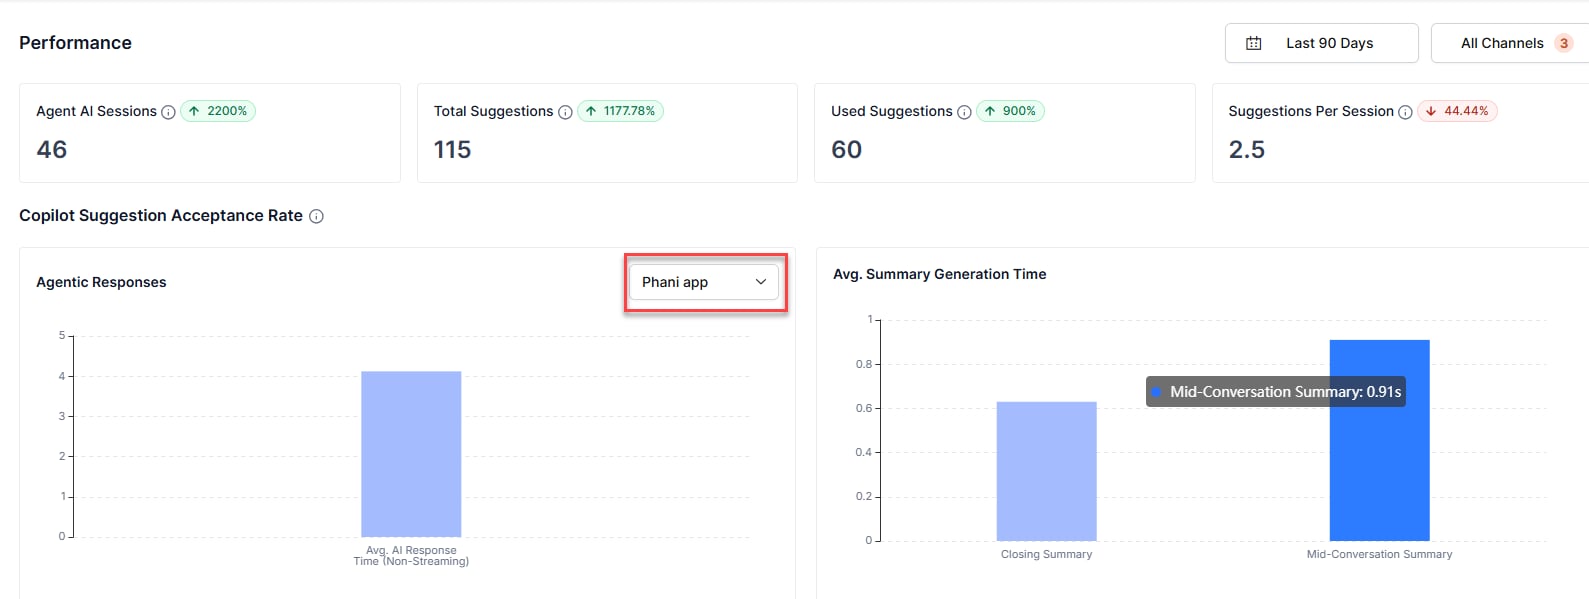
Session and suggestion metrics
The top of the Performance section shows four summary metrics for the selected date range. Each metric card includes a delta indicator (↑ or ↓) that compares the current period against the previous equivalent period.Copilot Suggestion Acceptance Rate
This section displays two panels side by side: Agentic Responses and Avg. Summary Generation Time.Agentic Responses
The Agentic Responses panel displays a bar chart of the average AI response time (non-streaming) for the selected Agentic app. Use the dropdown list to switch between configured Agentic apps. Hover over a bar to view the exact value in seconds.- App dropdown list: Filters the chart by the selected Agentic app.
- Avg. AI Response Time (Non-Streaming): Average time the system takes to generate a non-streaming AI response for the selected app.