Back to Analytics Overview The Overview section gives supervisors and administrators a date and channel-filtered view of how agents interact with the Agentic Copilot suggestions, search results, and conversation summaries. Use Overview to:
  • Monitor suggestion adoption rates.
  • Identify override patterns.
  • Measure summary generation performance.

Access Overview

  1. Sign in to AI for Service.
  2. Go to Agent AI > Analytics.
  3. Select Agent AI > Overview.
  4. Filter data based on the following table:
FilterDescription
Date rangeFilters all metrics by the selected time period. Defaults to Today.
ChannelsFilters data by channel—Chat, Voice, Email. Defaults to All Channels.
image

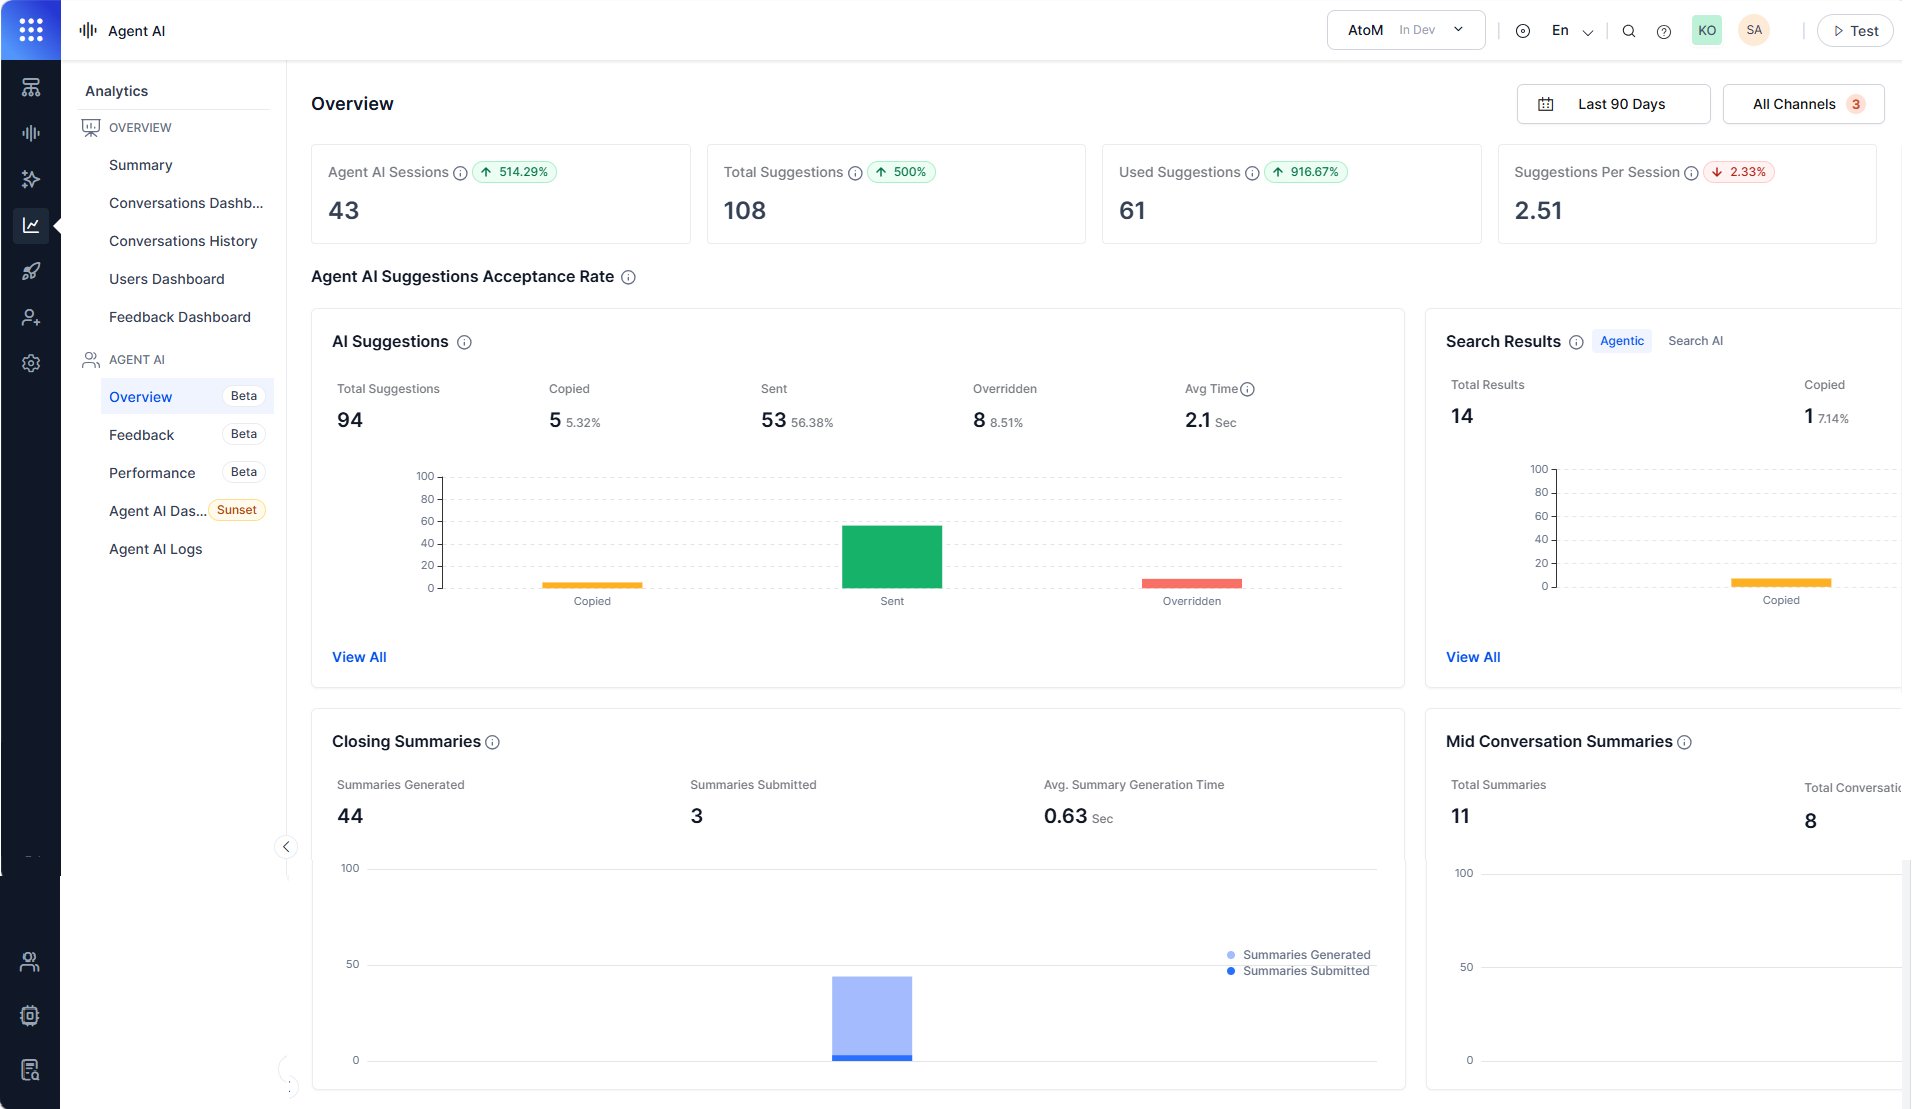
Session and suggestion metrics

The top of the Overview section shows four summary metrics for the selected date range. Each metric card includes a delta indicator (↑ or ↓) that compares the current period against the previous equivalent period.
MetricDescription
Agent AI SessionsTotal Agent AI widget sessions—My bot, search, and Agentic Copilot—across the selected time range.
Total SuggestionsTotal Agentic Copilot suggestions shown to agents across all sessions.
Used SuggestionsTotal suggestions used—copied or sent—across all sessions.
Suggestions Per SessionAverage number of suggestions per session.

Agent AI suggestions acceptance rate

The Agent AI Suggestions Acceptance Rate section breaks down how agents interact with the Agentic Copilot content. It contains two sub-sections:
  • AI Suggestions: Displays the Agentic Copilot suggestion usage metric.
  • Search Results: Displays the search result usage metric.

AI suggestions

The AI Suggestions panel displays how agents handle the AI-generated suggestions. A bar chart compares the Copied, Sent, and Overridden values.
MetricDescription
Total SuggestionsTotal AI-generated suggestions presented to agents.
CopiedSuggestions agents copied. Displays as a count and percentage of responses.
SentSuggestions agents sent directly to customers. Displays as a count and percentage of responses.
OverriddenThe number of custom requests agents sent to the Agentic app when the AI suggestions didn’t meet their expectations. Displays as a count and percentage of responses.
Avg TimeAverage time the system takes to generate each AI suggestion.

View All

Select View All to open the dialog lists per-conversation suggestion data in a table with the following columns:
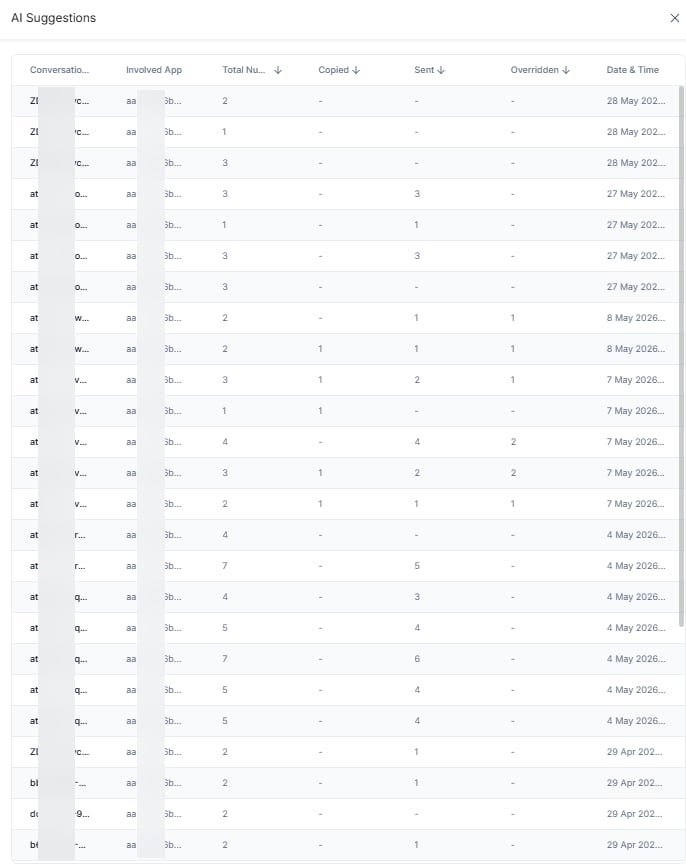
ColumnDescription
Conversation IDThe unique identifier for the conversation.
Involved AppThe Agentic App associated with the conversation.
Total Number of SuggestionsThe total count of AI-generated suggestions presented to the agent during the conversation.
CopiedThe number of suggestions the agent copied during the conversation.
SentThe number of suggestions the agent sent directly to the customer.
OverriddenThe number of times the agent sent a custom request instead of using the AI suggestion.
Date & TimeThe date and time the conversation occurred.
Overview-View-All Select a Conversation ID to view the Conversation Log. It shows the conversation summary, transcripts of customer-agent interactions, agent feedback on widget performance and AI suggestions, and conversation identifiers. Refer to Conversation Log for more details.

Search results

The Search Results panel displays how many search responses agents received, copied, and sent to customers from the Search tab.
MetricDescription
Total ResultsTotal search results the Search tab displays to agents.
CopiedSearch results agents copied. Displays as a count and percentage of responses.
SentSearch results agents sent to customers. Displays as a count and percentage of responses.

Closing summaries

The Closing Summaries panel displays how agents handled AI-generated end-of-conversation summaries. A bar chart tracks Summaries Generated and Summaries Submitted over the selected date range.
MetricDescription
Summaries GeneratedTotal end-of-conversation summaries the Agent AI widget generated.
Summaries SubmittedSummaries agents submitted.
Avg. Summary Generation TimeAverage time, in seconds, to generate a summary.

Mid-conversation summaries

The Mid Conversation Summaries panel displays metrics for intermittent summaries agents generate during active conversations. A bar chart tracks Total Summaries and Total Conversations over the selected time range.
MetricDescription
Total SummariesTotal intermittent summaries agents generated.
Total ConversationsConversations in which agents generated at least one intermittent summary.
Avg. Summaries Generated Per ConversationAverage intermittent summaries agents generated per conversation.