

- Monitor widget satisfaction rates.
- Identify low-performing suggestions.
- Review the top reasons agents give negative feedback.
- Monitor agent feedback on AI-generated summaries.
Access the feedback dashboard
- Sign in to AI for Service.
- Go to Agent AI > Analytics.
- Select Agent AI > Feedback.
- Filter data based on the following table:
Session and suggestion metrics
The top of the Feedback dashboard shows four summary metrics for the selected date range. Each metric card includes a delta indicator (↑ or ↓) that compares the current period against the previous equivalent period.Overall Agent AI widget feedback
The Overall Agent AI Widget Feedback panel shows how agents rate their overall experience with the Agent AI widget. A donut chart visualizes the distribution of Satisfied, Unsatisfied, and No Feedback responses across all conversations. Select or clear Satisfied, Unsatisfied, or No Feedback on the right of the donut chart to include or exclude the corresponding responses from the chart.Details
The Details bar chart shows the top five reasons agents selected Satisfied or Unsatisfied.- Select Satisfied or Unsatisfied to switch between views.
- Select View All to open the Details panel, which lists all feedback entries for the selected sentiment. The panel contains the following columns:
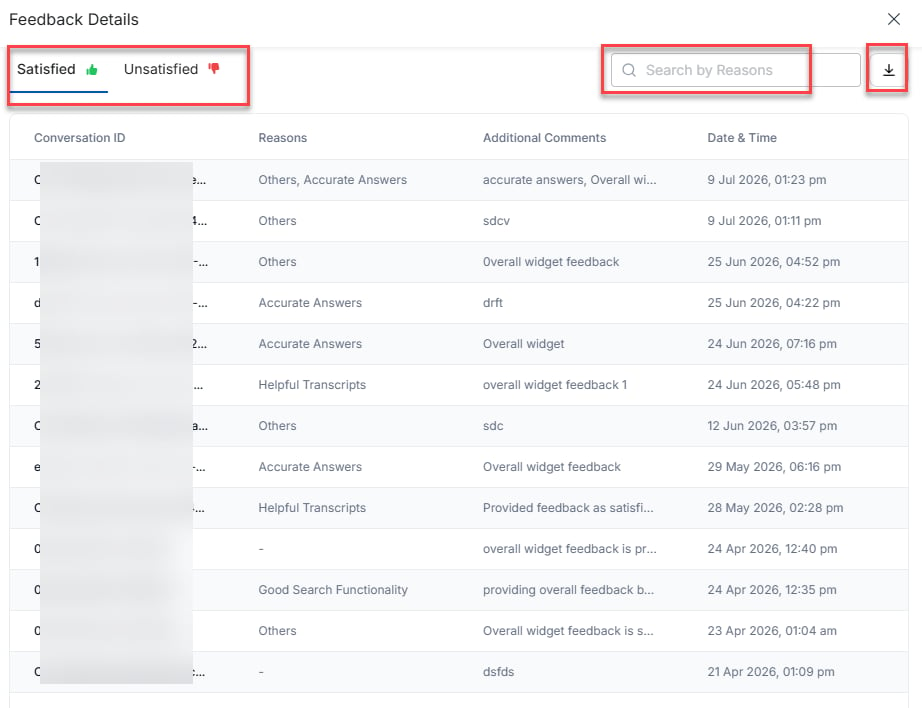
- Enter a reason in the Search by Reasons box to filter rows by matching words in the Reasons column.
- Select a Conversation ID to view the Conversation Log page. It shows the conversation summary, customer-agent transcripts, agent feedback on widget performance and AI suggestions, and conversation identifiers. For more details, see Conversation Log.
- Select the download icon to export the data in CSV format. In the confirmation window, select Proceed to save the file to your device, or select Cancel to close the window without exporting.
Suggestions feedback
The Suggestions Feedback panel shows how agents rate individual AI-generated suggestions. A donut chart visualizes the distribution of Positive, Negative, and No Feedback responses across all suggestions. Select or clear Positive, Negative, or No Feedback on the right of the donut chart to include or exclude the corresponding responses from the chart.Negative feedback reasons
The Negative Feedback Reasons bar chart shows the top five reasons agents gave negative feedback on AI-generated suggestions.- Select View All to see the complete list of negative feedback reasons.
- Select Negative or Positive to filter the list under those tabs.
- Enter a reason in the Search by Reasons box to filter rows by matching words in the Reasons column.
- Select a Conversation ID to view Conversation Logs.
- Select the download icon to export the data in CSV format. In the confirmation window, select Proceed to save the file to your device, or select Cancel to close the window without exporting.
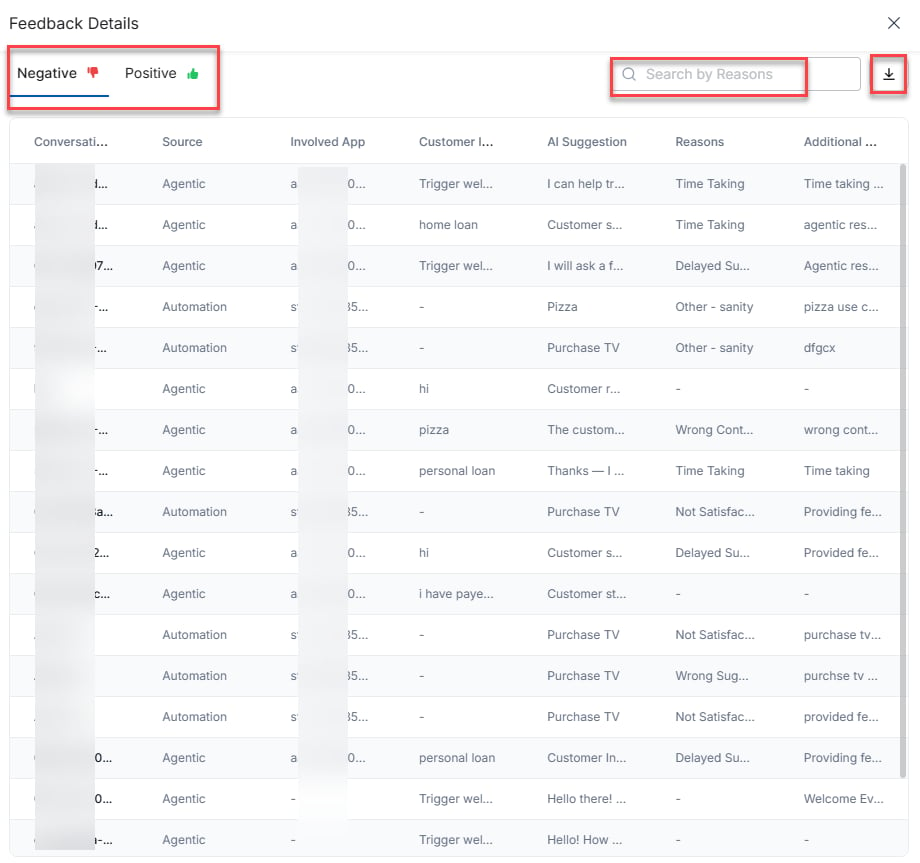
The Positive view excludes the Reasons and Additional Comments columns.
Summary Feedback
The Summary Feedback panel shows how agents rate AI-generated conversation summaries. A donut chart visualizes the distribution of Positive, Negative, and No Feedback responses. Select or clear Positive, Negative, or No Feedback on the right of the donut chart to include or exclude the corresponding responses from the chart.Feedback Reasons
The Feedback Reasons bar chart displays the top five reasons agents selected when submitting negative feedback on summaries for the selected summary type. Select Mid Conversation Summaries, Agent Transfer, or Closing to filter the panel by summary type.- Select View All to see the complete list of negative feedback reasons.
- Select Negative or Positive to filter the list under those tabs.
- Enter a reason in the Search by Reasons box to filter rows by matching words in the Reasons column.
- Select a Conversation ID to view Conversation Logs.
- Select the download icon to export the data in CSV format. In the confirmation window, select Proceed to save the file to your device, or select Cancel to close the window without exporting.