> ## Documentation Index
> Fetch the complete documentation index at: https://koreai.mintlify.site/llms.txt
> Use this file to discover all available pages before exploring further.
# Topic Discovery
Topic Discovery helps QA managers, supervisors, and CX teams analyze conversation trends through interactive visualizations. It identifies recurring issues, monitors customer sentiment and resolution trends, and supports data-driven coaching and process improvements.
The dashboard supports analysis of Inbound and Outbound interactions through the Channel filter and AI Agent, Human Agent, or both conversation types through the Handled By filter. All visualizations and metrics update based on the selected filters.
Topic Discovery includes both configured and AI-generated intents for bot conversations. AI Agent and Human Agent conversations share the same L1/L2/L3 topic taxonomy, enabling consistent topic analysis across all conversation types
***
## Why Use Topic Discovery?
### Topic Analysis Capabilities
| **Capability** | **Description** |
| ----------------------------- | --------------------------------------------------------------------------------------------------------------- |
| **Pattern Recognition** | Identifies recurring conversation themes and trends across AI Agent, Human Agent, or combined conversations. |
| **Performance Analysis** | Correlates topics with key metrics such as sentiment, resolution rate, and Average Handle Time (AHT). |
| **Emerging Issue Detection** | Surfaces configured and AI-generated topics early to help teams address issues before they escalate. |
| **Targeted Coaching** | Highlights low-performing topics to guide training and process improvements. |
| **Conversation Segmentation** | Enables separate analysis of AI Agent, Human Agent, or both conversation types using the **Handled By** filter. |
| **Cross-Queue Visibility** | Users with Cross Queue Data Access can analyze topics across all queues without individual queue assignment. |
***
## Key Capabilities
* **Trend Identification**: Identify high-volume topics and their performance impact to assess operational health.
* **Coaching Focus**: Pinpoint topics with low sentiment or resolution rates for targeted coaching and improvement.
* **Performance Monitoring**: Track topic-level metrics such as AHT, sentiment, and resolution rate for objective evaluation.
* **Proactive Management**: Detect emerging topics early using AI-generated insights to prevent escalation.
* **Handled By Filtering**: Filters analytics by All, Human Agent, or AI Agent segments; All combines both, while each mode shows only its respective segment (AI or human).
* **Direction-Aware Analysis**: Filter all topic views by Inbound or Outbound interactions.
***
## Prerequisite
* Topic Discovery analyzes AI Agent conversations only when the Automation AI conversation source is enabled for the workspace.
* If the Automation AI conversation source is disabled, AI Agent conversations are excluded from Topic Discovery, while Human Agent conversations continue to be analyzed.
* AI Agent conversations are included automatically once both the Conversation Intelligence feature and Automation AI conversation source are enabled.
## Access Topic Discovery
Navigate to **Quality AI** > **AutoQA** > **Topic Discovery**.
 ## Topic Hierarchy
Topic Discovery uses a three-level structure:
| Level | Description | Example |
| ------ | -------------------------- | -------------------- |
| **L1** | Top-level theme | Billing Issues |
| **L2** | Subtopic under L1 | Payment Problems |
| **L3** | Granular subtopic under L2 | Credit Card Declined |
Note: Bot conversations, AI Agent conversations, and Human Agent conversations all use the same L1/L2/L3 taxonomy, ensuring consistent reporting across all interaction types.
***
## Filters
The top filter bar is the central control panel for customizing the Topic Discovery dashboard. Every adjustment updates the visualization in real time.
## Topic Hierarchy
Topic Discovery uses a three-level structure:
| Level | Description | Example |
| ------ | -------------------------- | -------------------- |
| **L1** | Top-level theme | Billing Issues |
| **L2** | Subtopic under L1 | Payment Problems |
| **L3** | Granular subtopic under L2 | Credit Card Declined |
Note: Bot conversations, AI Agent conversations, and Human Agent conversations all use the same L1/L2/L3 taxonomy, ensuring consistent reporting across all interaction types.
***
## Filters
The top filter bar is the central control panel for customizing the Topic Discovery dashboard. Every adjustment updates the visualization in real time.
 ### Filters Overview
| **Filter** | **What it does** | **How to use it** | **When to use it** |
| --------------------------------------- | ---------------------------------------------------------------- | ------------------------------------------------------------------------------------------------------- | ------------------------------------------------------------------------- |
| Search Topic Names | Locates topics within the visualization. | Start typing a keyword; matching topics are highlighted instantly. | Use when looking for a specific customer issue (e.g., `Payment Failure`). |
| Configured Intents or Generated Intents | Switches between taxonomy-based topics and AI-discovered themes. | Select **Configured Intents** if your taxonomy is set, or **Generated Intents** to surface blind spots. | Use **Generated Intents** to uncover new themes not yet in your taxonomy. |
| Time Range Selector | Adjusts the analysis period. | Choose from 7 days (default), 28 days, 30 days, 90 days, or a custom date range. | Compare weekly vs. monthly trends to identify recurring issues. |
| Sentiment Filter | Focuses on conversations by sentiment. | Adjust the score range slider (0–10). Default is full range. | Narrow results to low-sentiment conversations for quality monitoring. |
| Resolution Filter | Filters by resolution success rates. | Adjust the score range slider (0–100). Default is full range. | Focus on unresolved or low-resolution conversations. |
### Advanced Topic Filters
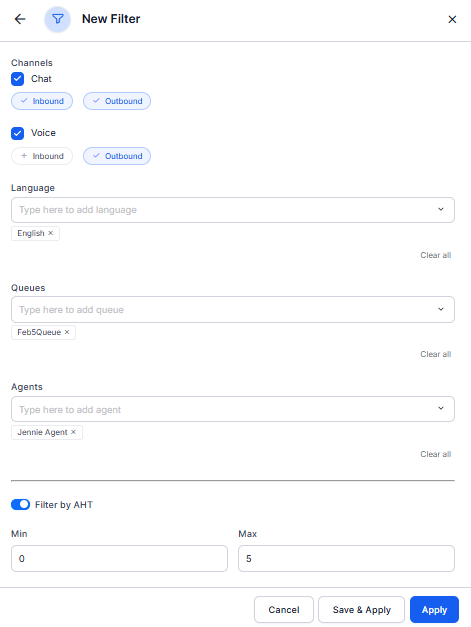
Select **Filters** to access additional filtering options and refine the dashboard view.
| Filter | Options |
| ------------ | ---------------------------------------------------------------------------------------------------------------------- |
| **Channel** | Filter by Voice or Chat or with additional selection for Inbound and Outbound interactions. |
| **Language** | Multi-select with search to select one or more languages, and helps in removing individual selections or clearing all. |
| **Queue** | Narrow by specific queues, and the Agent filter updates automatically. |
| **Agent** | Search and select one or more agents based on selected queues. |
| **AHT** | Set minimum and maximum values in seconds or define an acceptable variance range. |
### Filters Overview
| **Filter** | **What it does** | **How to use it** | **When to use it** |
| --------------------------------------- | ---------------------------------------------------------------- | ------------------------------------------------------------------------------------------------------- | ------------------------------------------------------------------------- |
| Search Topic Names | Locates topics within the visualization. | Start typing a keyword; matching topics are highlighted instantly. | Use when looking for a specific customer issue (e.g., `Payment Failure`). |
| Configured Intents or Generated Intents | Switches between taxonomy-based topics and AI-discovered themes. | Select **Configured Intents** if your taxonomy is set, or **Generated Intents** to surface blind spots. | Use **Generated Intents** to uncover new themes not yet in your taxonomy. |
| Time Range Selector | Adjusts the analysis period. | Choose from 7 days (default), 28 days, 30 days, 90 days, or a custom date range. | Compare weekly vs. monthly trends to identify recurring issues. |
| Sentiment Filter | Focuses on conversations by sentiment. | Adjust the score range slider (0–10). Default is full range. | Narrow results to low-sentiment conversations for quality monitoring. |
| Resolution Filter | Filters by resolution success rates. | Adjust the score range slider (0–100). Default is full range. | Focus on unresolved or low-resolution conversations. |
### Advanced Topic Filters
Select **Filters** to access additional filtering options and refine the dashboard view.
| Filter | Options |
| ------------ | ---------------------------------------------------------------------------------------------------------------------- |
| **Channel** | Filter by Voice or Chat or with additional selection for Inbound and Outbound interactions. |
| **Language** | Multi-select with search to select one or more languages, and helps in removing individual selections or clearing all. |
| **Queue** | Narrow by specific queues, and the Agent filter updates automatically. |
| **Agent** | Search and select one or more agents based on selected queues. |
| **AHT** | Set minimum and maximum values in seconds or define an acceptable variance range. |
 ## Bubble Visualization Canvas
The central visualization displays topics as interactive bubbles with meaningful visual encoding, providing an at-a-glance view of conversation volumes, performance metrics, and relationships between topics. This intuitive interface allows you to explore your conversation data spatially, with visual cues guiding you to areas that need attention.
* AI Agent displays metrics derived only from AI Agent conversation segments.
* Human Agent displays metrics derived only from Human Agent conversation segments.
* All displays aggregated metrics across both conversation segments.
### Bubble Chart Display
The central visualization displays topics as interactive bubbles, encoding meaningful data visually.
Each bubble encodes key topic attributes visually:
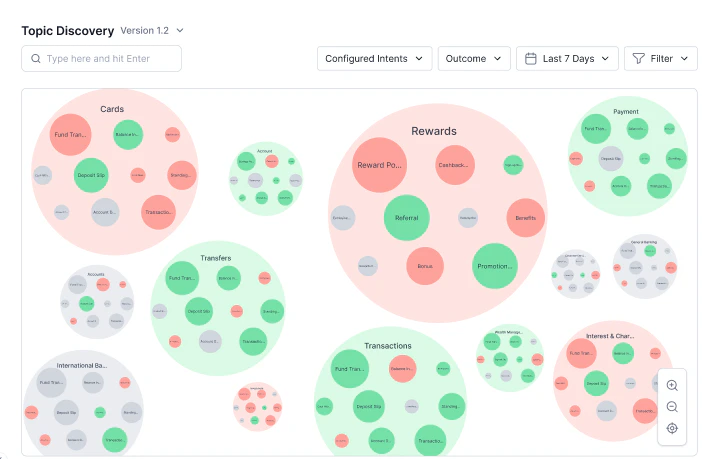
* **Bubble Size**: Represents conversation volume. Larger bubbles indicate a higher number of conversations.
* **Bubble Color**: Indicates topic performance based on the selected metric (sentiment or resolution).
* **Positioning**: Groups related topics together to reveal patterns and clusters.
* **Labels**: L1 topics are labeled outside the bubbles. L2 and L3 topics are labeled inside.
You can switch bubble coloring between sentiment and resolution, while continuing to filter topics using both metrics simultaneously (AND logic).
## Bubble Visualization Canvas
The central visualization displays topics as interactive bubbles with meaningful visual encoding, providing an at-a-glance view of conversation volumes, performance metrics, and relationships between topics. This intuitive interface allows you to explore your conversation data spatially, with visual cues guiding you to areas that need attention.
* AI Agent displays metrics derived only from AI Agent conversation segments.
* Human Agent displays metrics derived only from Human Agent conversation segments.
* All displays aggregated metrics across both conversation segments.
### Bubble Chart Display
The central visualization displays topics as interactive bubbles, encoding meaningful data visually.
Each bubble encodes key topic attributes visually:
* **Bubble Size**: Represents conversation volume. Larger bubbles indicate a higher number of conversations.
* **Bubble Color**: Indicates topic performance based on the selected metric (sentiment or resolution).
* **Positioning**: Groups related topics together to reveal patterns and clusters.
* **Labels**: L1 topics are labeled outside the bubbles. L2 and L3 topics are labeled inside.
You can switch bubble coloring between sentiment and resolution, while continuing to filter topics using both metrics simultaneously (AND logic).
 #### Sentiment Visualization Across Topic Hierarchy
Customer sentiment is captured at the L3 level and aggregated across L2 and L1 topics. Topic Discovery uses color-coded indicators: green (positive), gray (neutral), and red (poor), helping identify sentiment trends across the topic hierarchy.
#### Resolution-Based Visualization
When resolution-based coloring is applied, topics appear as red (0–50%), grey (50–70%), and green (70–100%). Changing the coloring mode affects only visualization; sentiment and resolution filters remain active together, enabling combined analysis of topic performance.
***
### Bobble Tooltips
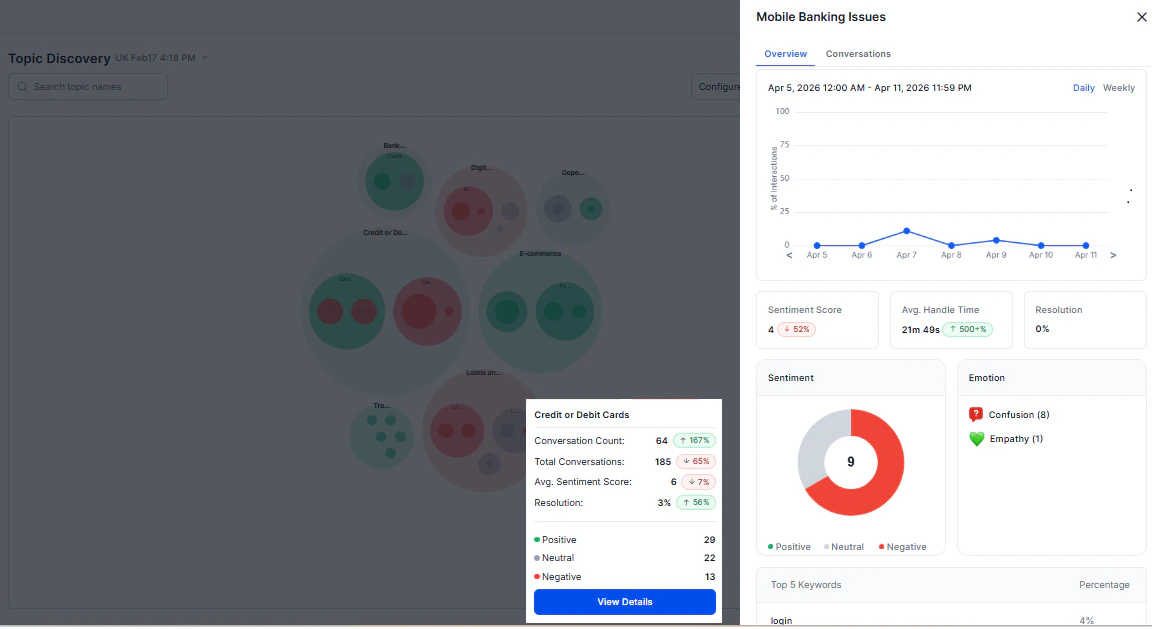
Hovering over any bubble reveals a detailed tooltip that provides quick access to key metrics without leaving the main visualization. This instant feedback mechanism helps you assess topic performance and identify areas for deeper investigation.
| Field | Description |
| ----------------------- | -------------------------------------------------------------------- |
| **Topic Name** | Full name if truncated in the visualization. |
| **Conversation Count** | Total interactions for that topic. |
| **Total Conversations** | Total conversations with trend indicators (spike or dip) percentage. |
| **Average Sentiment** | Average of the overall sentiment score with trend analysis. |
| **Sentiment Breakdown** | Distribution across positive, neutral, and negative interactions. |
#### Sentiment Visualization Across Topic Hierarchy
Customer sentiment is captured at the L3 level and aggregated across L2 and L1 topics. Topic Discovery uses color-coded indicators: green (positive), gray (neutral), and red (poor), helping identify sentiment trends across the topic hierarchy.
#### Resolution-Based Visualization
When resolution-based coloring is applied, topics appear as red (0–50%), grey (50–70%), and green (70–100%). Changing the coloring mode affects only visualization; sentiment and resolution filters remain active together, enabling combined analysis of topic performance.
***
### Bobble Tooltips
Hovering over any bubble reveals a detailed tooltip that provides quick access to key metrics without leaving the main visualization. This instant feedback mechanism helps you assess topic performance and identify areas for deeper investigation.
| Field | Description |
| ----------------------- | -------------------------------------------------------------------- |
| **Topic Name** | Full name if truncated in the visualization. |
| **Conversation Count** | Total interactions for that topic. |
| **Total Conversations** | Total conversations with trend indicators (spike or dip) percentage. |
| **Average Sentiment** | Average of the overall sentiment score with trend analysis. |
| **Sentiment Breakdown** | Distribution across positive, neutral, and negative interactions. |
 ***
### Configured vs. Generated Intents
Topic Discovery provides two topic views to support different analysis needs.
| **View** | **Description** | **When to Use** |
| ---------------------- | ----------------------------------------------------------------------------------------------------- | ---------------------------------------------------------------------------------------------------------------- |
| **Configured Intents** | Displays topics based on your organization's predefined taxonomy and trained conversation categories. | Monitor known business categories, track taxonomy performance, and compare historical trends. |
| **Generated Intents** | Uses AI to automatically discover conversation themes that may not exist in the configured taxonomy. | Identify blind spots, detect emerging issues, explore unexpected conversation patterns, and expand the taxonomy. |
To create or update your taxonomy, see [Taxonomy Setup](/ai-for-service/quality-ai/analyze/topic-discovery).
***
## Topic View Detail Pane
Topic metrics reflect the selected **Handled By** filter and use data from the corresponding conversation segment.
Select **View Details** from any bubble tooltip to open the detail slideout for a specific topic. The detailed slideout provides comprehensive analytics for individual topics, combining historical trends, performance metrics, and qualitative insights.
### Overview Tab
Shows the **Overview** tab to analyze topic performance over time.
#### Time Granularity
Use this you can switch between Daily and Weekly views based on your analysis needs.
#### Time Granularity
Use the **Time Granularity** toggle to switch between **Daily** and **Weekly** views based on your analysis needs.
| **View** | **Description** | **Best For** |
| ---------- | ------------------------------------------------------------------------------------------------------ | ---------------------------------------------------------------------- |
| **Daily** | Displays day-by-day trends to monitor short-term fluctuations and immediate issues. | Tactical monitoring and identifying recent changes. |
| **Weekly** | Aggregates data into weekly trends to identify patterns, reduce noise, and support strategic analysis. | Trend analysis, pattern identification, and long-term decision-making. |
#### Topic Metrics
Review topic-level performance metrics to understand conversation volume, customer sentiment, operational efficiency, and resolution outcomes over the selected time period.
| **Metric** | **Description** |
| ----------------------------- | --------------------------------------------------------------------------------------- |
| **Total Conversations (%)** | Shows the topic's share of all conversations. |
| **Average Sentiment Score** | Displays the overall sentiment score and its trend over time. |
| **Sentiment Breakdown** | Shows the distribution of conversations by sentiment (Positive, Neutral, and Negative). |
| **Average Handle Time (AHT)** | Displays the average handle time and its trend for the selected topic. |
| **Average Resolution (%)** | Shows the resolution rate and its trend over time. |
| **Top Keywords** | Lists the most frequently occurring keywords for the selected topic. |
| **Emotion Detection** | Displays the top six emotions identified in conversations for the selected topic. |
***
### Configured vs. Generated Intents
Topic Discovery provides two topic views to support different analysis needs.
| **View** | **Description** | **When to Use** |
| ---------------------- | ----------------------------------------------------------------------------------------------------- | ---------------------------------------------------------------------------------------------------------------- |
| **Configured Intents** | Displays topics based on your organization's predefined taxonomy and trained conversation categories. | Monitor known business categories, track taxonomy performance, and compare historical trends. |
| **Generated Intents** | Uses AI to automatically discover conversation themes that may not exist in the configured taxonomy. | Identify blind spots, detect emerging issues, explore unexpected conversation patterns, and expand the taxonomy. |
To create or update your taxonomy, see [Taxonomy Setup](/ai-for-service/quality-ai/analyze/topic-discovery).
***
## Topic View Detail Pane
Topic metrics reflect the selected **Handled By** filter and use data from the corresponding conversation segment.
Select **View Details** from any bubble tooltip to open the detail slideout for a specific topic. The detailed slideout provides comprehensive analytics for individual topics, combining historical trends, performance metrics, and qualitative insights.
### Overview Tab
Shows the **Overview** tab to analyze topic performance over time.
#### Time Granularity
Use this you can switch between Daily and Weekly views based on your analysis needs.
#### Time Granularity
Use the **Time Granularity** toggle to switch between **Daily** and **Weekly** views based on your analysis needs.
| **View** | **Description** | **Best For** |
| ---------- | ------------------------------------------------------------------------------------------------------ | ---------------------------------------------------------------------- |
| **Daily** | Displays day-by-day trends to monitor short-term fluctuations and immediate issues. | Tactical monitoring and identifying recent changes. |
| **Weekly** | Aggregates data into weekly trends to identify patterns, reduce noise, and support strategic analysis. | Trend analysis, pattern identification, and long-term decision-making. |
#### Topic Metrics
Review topic-level performance metrics to understand conversation volume, customer sentiment, operational efficiency, and resolution outcomes over the selected time period.
| **Metric** | **Description** |
| ----------------------------- | --------------------------------------------------------------------------------------- |
| **Total Conversations (%)** | Shows the topic's share of all conversations. |
| **Average Sentiment Score** | Displays the overall sentiment score and its trend over time. |
| **Sentiment Breakdown** | Shows the distribution of conversations by sentiment (Positive, Neutral, and Negative). |
| **Average Handle Time (AHT)** | Displays the average handle time and its trend for the selected topic. |
| **Average Resolution (%)** | Shows the resolution rate and its trend over time. |
| **Top Keywords** | Lists the most frequently occurring keywords for the selected topic. |
| **Emotion Detection** | Displays the top six emotions identified in conversations for the selected topic. |
 ### Conversations Tab
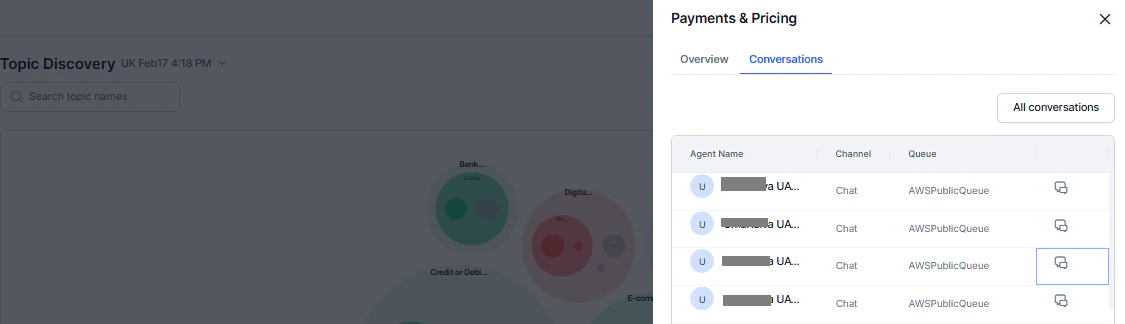
Shows the **Conversations** tab with list and detailed views of interactions for analysis of the selected topic.
### Conversations Tab
Shows the **Conversations** tab with list and detailed views of interactions for analysis of the selected topic.
 #### Conversation List Columns
| Column | Information | Purpose |
| -------------- | -------------------- | ---------------------------------- |
| **Agent Name** | Name | Identify the conversation handler. |
| **Channel** | Voice or Chat | Understand the interaction method. |
| **Queue** | Service category | Context for conversation type. |
| **Actions** | Conversation details | Access full interaction details. |
#### Navigation and Access
The Conversation List view displays individual interactions and lets you search, sort, and filter conversations to quickly identify patterns and locate specific interactions.
* **Sorting**: Most recent conversations first.
* **Pagination**: 10 conversations per page.
* **Page Jumping**: Direct access to specific pages.
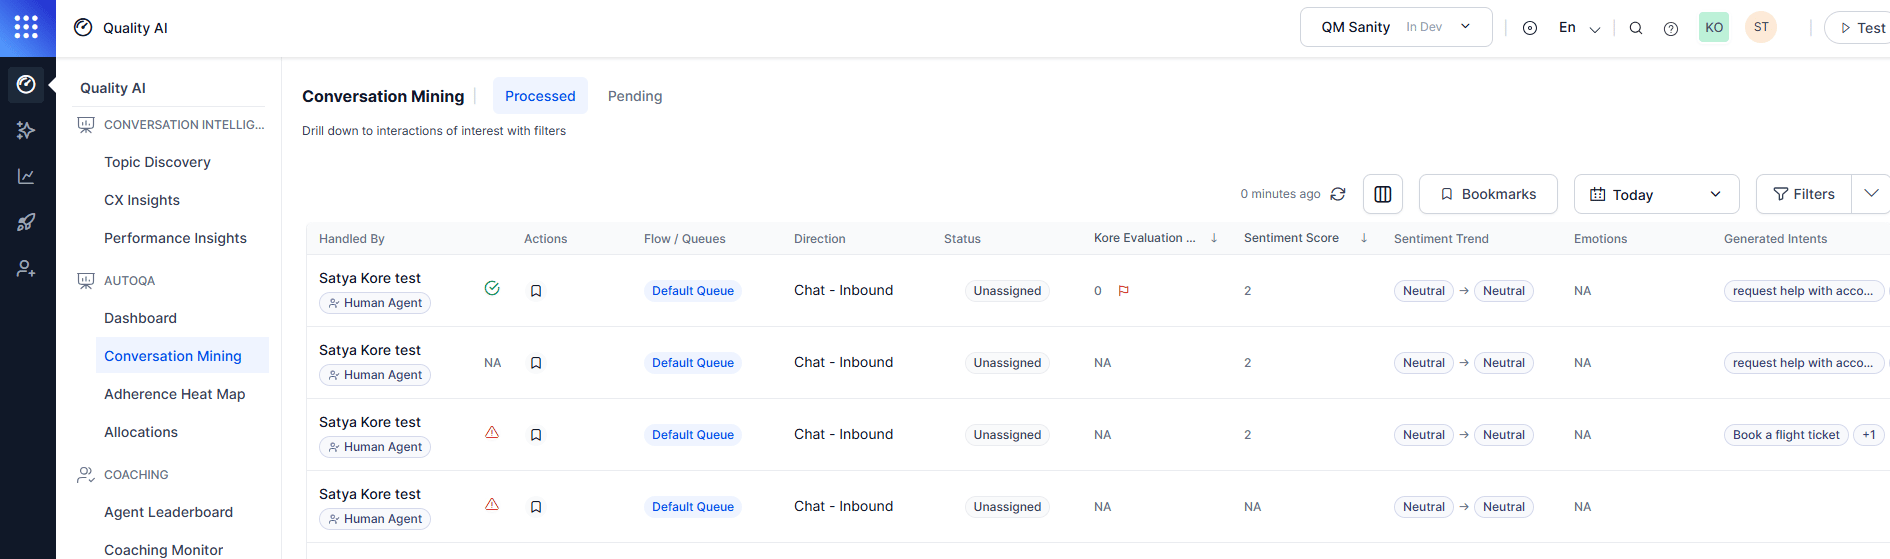
* **All Conversations**: Opens [Conversation Mining - Interactions](/ai-for-service/quality-ai/analyze/conversation-mining-audit-allocations) with topic filters applied.
#### Conversation List Columns
| Column | Information | Purpose |
| -------------- | -------------------- | ---------------------------------- |
| **Agent Name** | Name | Identify the conversation handler. |
| **Channel** | Voice or Chat | Understand the interaction method. |
| **Queue** | Service category | Context for conversation type. |
| **Actions** | Conversation details | Access full interaction details. |
#### Navigation and Access
The Conversation List view displays individual interactions and lets you search, sort, and filter conversations to quickly identify patterns and locate specific interactions.
* **Sorting**: Most recent conversations first.
* **Pagination**: 10 conversations per page.
* **Page Jumping**: Direct access to specific pages.
* **All Conversations**: Opens [Conversation Mining - Interactions](/ai-for-service/quality-ai/analyze/conversation-mining-audit-allocations) with topic filters applied.
 #### Full Conversation View
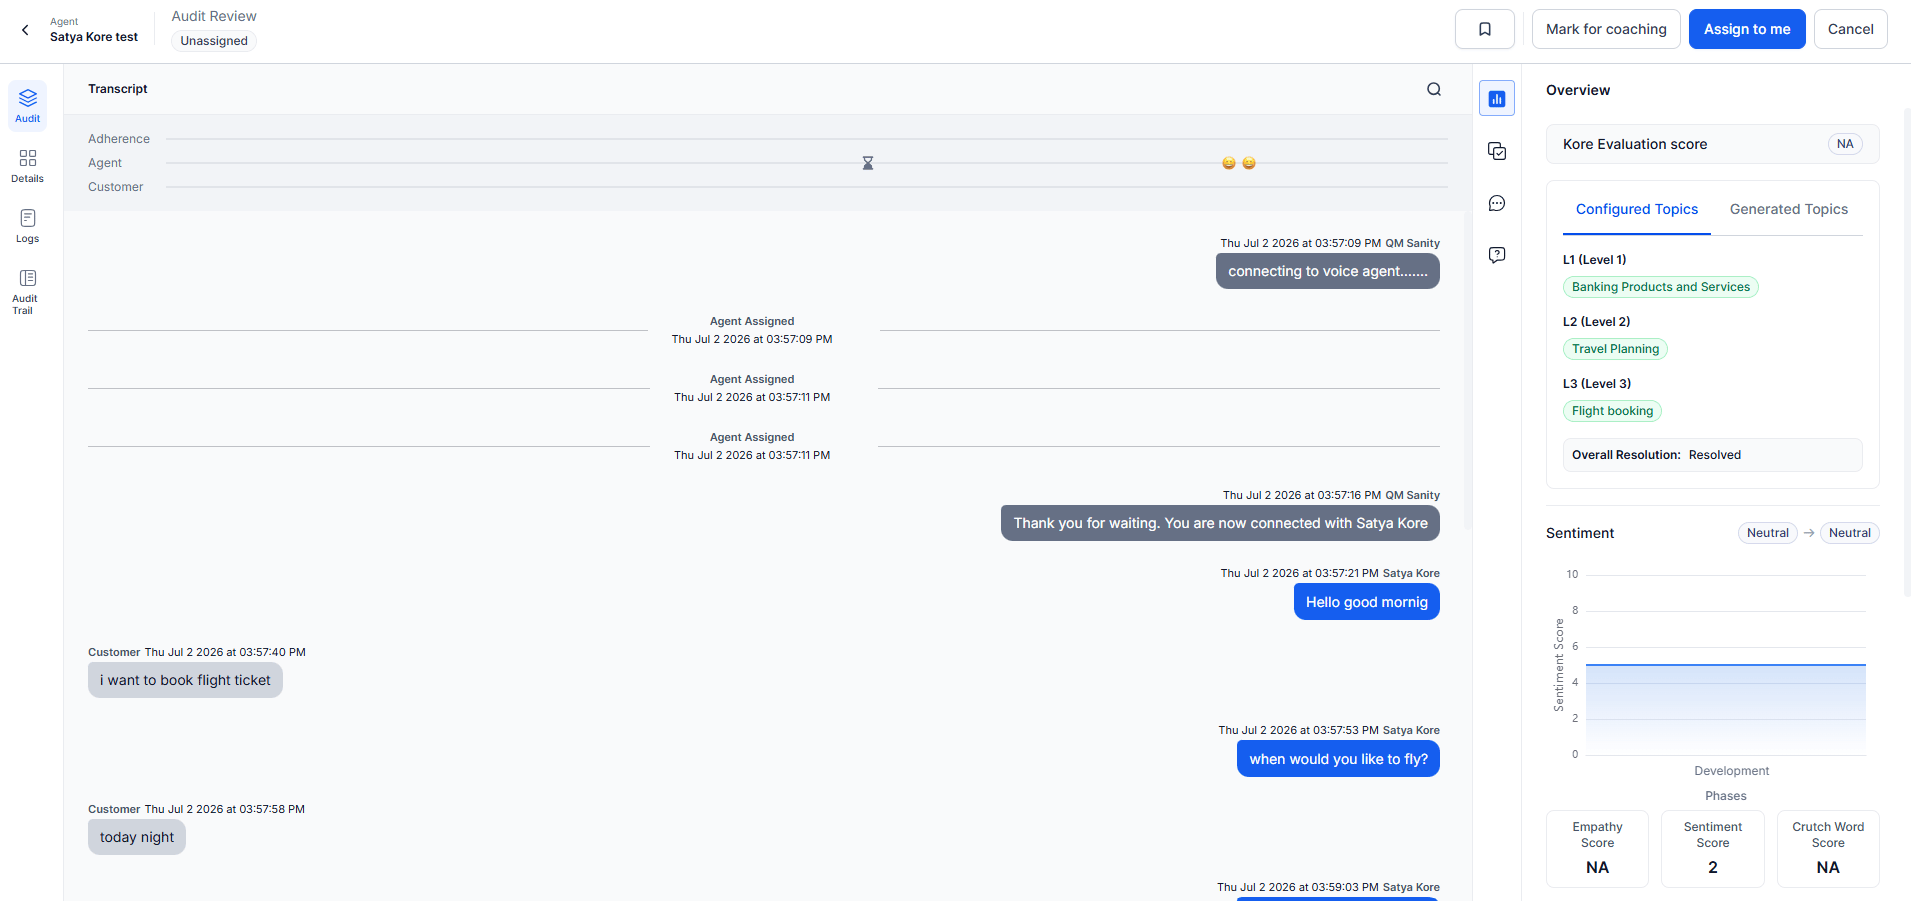
Open the conversation icon from the **Conversations** Tab to view a detailed interaction breakdown with full thread, metadata, and analytics in one panel.
#### Conversation Details
| Section | Content |
| ---------------------- | ------------------------------------------------------- |
| **Complete Thread** | Full customer-agent interaction. |
| **Topic Highlighting** | Topic markers within the conversation. |
| **Metadata** | Channel, duration, resolution status, sentiment scores. |
| **Timeline View** | Chronological conversation flow. |
| **Context** | Queue, agent, and channel details. |
| **Handled By** | AI and Human agents. |
#### Analysis Tools
| Tool | Description |
| --------------------- | ---------------------------------------------- |
| **Sentiment Score** | Sentiment throughout the conversation. |
| **Empathy Score** | Empathy throughout the conversation. |
| **Crutch Word Score** | Crutch word usage throughout the conversation. |
#### Full Conversation View
Open the conversation icon from the **Conversations** Tab to view a detailed interaction breakdown with full thread, metadata, and analytics in one panel.
#### Conversation Details
| Section | Content |
| ---------------------- | ------------------------------------------------------- |
| **Complete Thread** | Full customer-agent interaction. |
| **Topic Highlighting** | Topic markers within the conversation. |
| **Metadata** | Channel, duration, resolution status, sentiment scores. |
| **Timeline View** | Chronological conversation flow. |
| **Context** | Queue, agent, and channel details. |
| **Handled By** | AI and Human agents. |
#### Analysis Tools
| Tool | Description |
| --------------------- | ---------------------------------------------- |
| **Sentiment Score** | Sentiment throughout the conversation. |
| **Empathy Score** | Empathy throughout the conversation. |
| **Crutch Word Score** | Crutch word usage throughout the conversation. |
 ***
## Use Case: Identifying Agent Coaching Opportunities
**Scenario**: A QA Manager notices increasing customer complaints and needs to find specific areas for improvement.
### Step-by-Step
1. **Initial analysis**
* Open Topic Discovery with the default 7-day view.
* Scan L1 topics for large bubbles with negative sentiment.
* Identify `Technical Support` as a high-volume, low-sentiment topic.
2. **Drill-down investigation**
* Select `Technical Support` to reveal L2 topics.
* Notice `Software Installation` has poor resolution rates.
* Select `Software Installation` to see L3 subtopics.
* Identify `Driver Installation` as the primary problem area.
3. **Detailed analysis**
* Open the `Driver Installation` detail pane.
* Metrics: 150 conversations, 45% resolution rate, average sentiment: 2.
* Top keywords: `error`, `crash`, `incompatible`, `frustrated`.
* Top emotions: Anger (40%), Frustration (35%), Confusion (25%).
4. **Conversation review**
* Select **View Conversations** to review individual interactions.
* Review 3-4 representative conversations to identify failure patterns.
* Identify knowledge gaps in driver troubleshooting procedures.
5. **Action planning**
* Develop a targeted training module on driver installation.
* Create job aids for common driver compatibility issues.
* Schedule coaching sessions with agents handling technical support.
**Outcome**: Focused coaching based on data-driven insights leads to improved resolution rates and customer satisfaction.
***
***
## Use Case: Identifying Agent Coaching Opportunities
**Scenario**: A QA Manager notices increasing customer complaints and needs to find specific areas for improvement.
### Step-by-Step
1. **Initial analysis**
* Open Topic Discovery with the default 7-day view.
* Scan L1 topics for large bubbles with negative sentiment.
* Identify `Technical Support` as a high-volume, low-sentiment topic.
2. **Drill-down investigation**
* Select `Technical Support` to reveal L2 topics.
* Notice `Software Installation` has poor resolution rates.
* Select `Software Installation` to see L3 subtopics.
* Identify `Driver Installation` as the primary problem area.
3. **Detailed analysis**
* Open the `Driver Installation` detail pane.
* Metrics: 150 conversations, 45% resolution rate, average sentiment: 2.
* Top keywords: `error`, `crash`, `incompatible`, `frustrated`.
* Top emotions: Anger (40%), Frustration (35%), Confusion (25%).
4. **Conversation review**
* Select **View Conversations** to review individual interactions.
* Review 3-4 representative conversations to identify failure patterns.
* Identify knowledge gaps in driver troubleshooting procedures.
5. **Action planning**
* Develop a targeted training module on driver installation.
* Create job aids for common driver compatibility issues.
* Schedule coaching sessions with agents handling technical support.
**Outcome**: Focused coaching based on data-driven insights leads to improved resolution rates and customer satisfaction.
***