Access My Dashboard
Navigate to Quality AI > AutoQA > My Dashboard.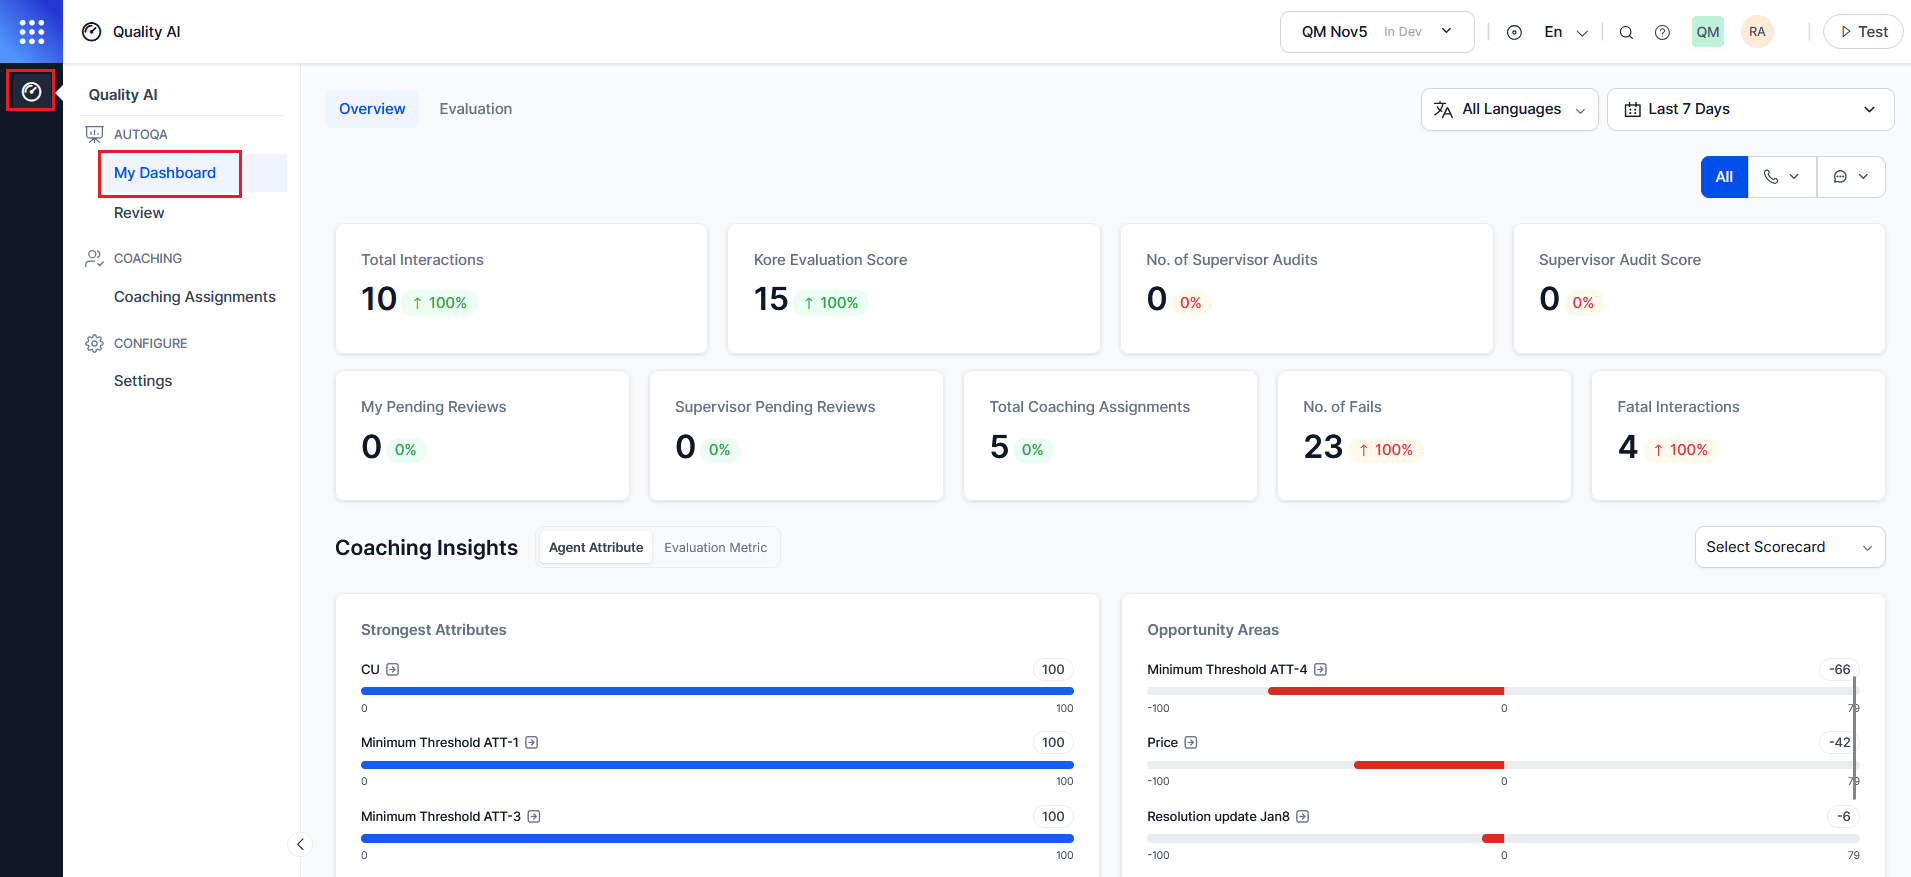
In Quality AI > Settings > Quality AI General Settings, enable Auto QA, Agent Scorecard, and Agent Access to Scored Interactions to view dashboard data, and enable Agent Accept & Dispute to activate the acknowledgement and dispute workflow.
My Dashboard Filters
My Dashboard uses shared global filters across all widgets to refine data by language, date range, channel, and contact direction. All metrics update dynamically based on the selected filters.By default, all languages are selected. Metrics display only for languages configured at the evaluation metric level.
Filter-Driven Metrics
Based on Language, Date Range, Channel, and Contact Direction applied, the following widgets update:Agent Performance Metrics
Displays key performance indicators based on selected filters. Each widget shows the current value and % change (↑ improvement, ↓ decline).My Pending Reviews and Supervisor Pending Reviews are visible only when Agent Accept & Dispute is enabled in Quality AI > Settings > Quality AI General Settings and disputes are configured for one or more evaluation forms.
Coaching Insights
Displays agent strengths and coaching needs using scorecard and evaluation data at attribute and metric levels. Available in My Dashboard, Supervisor View (Agent Dashboard), and the Evaluation tab. The Coaching Insights section identifies strong performance areas and coaching opportunities for the agent. It includes the following two tabs:Scorecard Selection
The Coaching Insights feature highlights an agent’s strengths and improvement areas based on selected scorecards. It recalculates insights when you update the scorecard selection. To select a scorecard, use the Select Scorecard dropdown and choose one or more scorecards. The system automatically updates the insights.Agent Attribute Tab
Based on the selected scorecard and date range, this tab displays performance at the attribute level.
Each attribute displays as a labeled bar representing adherence across the selected period.
Click-through (Attribute to Metric Modal)
Selecting an attribute opens a detailed metric-level view.Adherence Color Coding
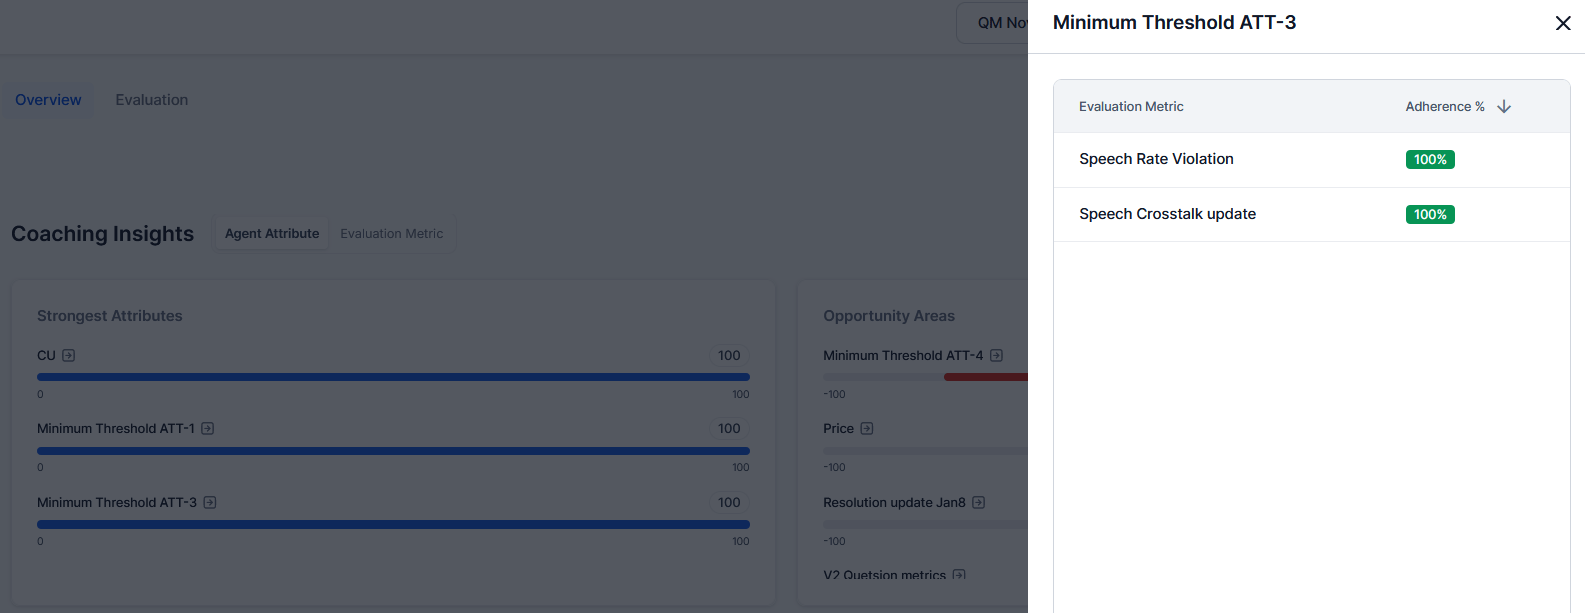
Evaluation Metric Tab
Based on the selected scorecard and date range, this tab displays performance across evaluation metrics in two panels.
Each metric displays as a labeled bar indicating adherence across the selected period. Evaluation forms assigned at the queue level determine the metrics.
Hover Insight (Metric — Attribute)
Hover over a metric to view its mapped agent attribute for quick traceability without changing views. Example: Hovering over Authentication displays (Agent Attribute: Authentication).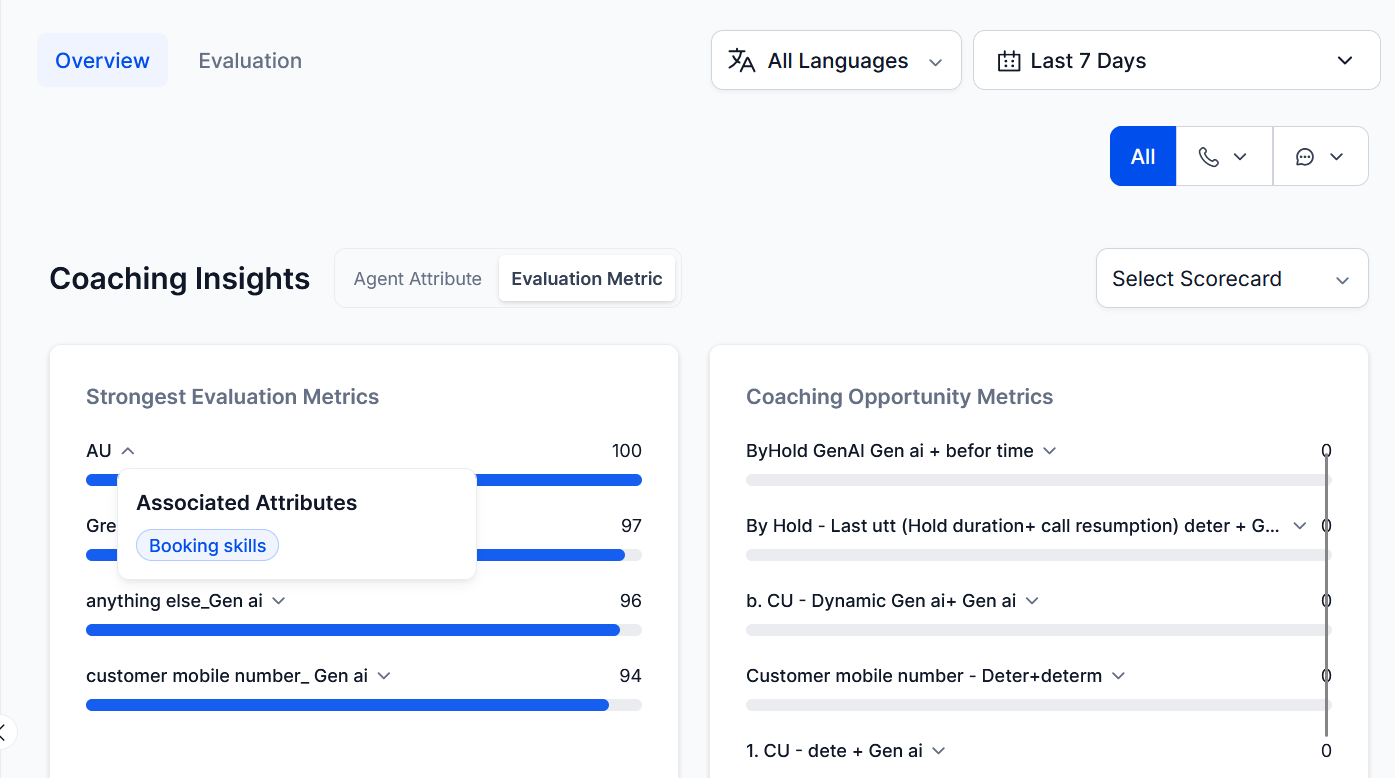
Sentiment Insights
Displays customer sentiment across the agent’s own conversations. Helps agents recognize strengths and identify recurring issues.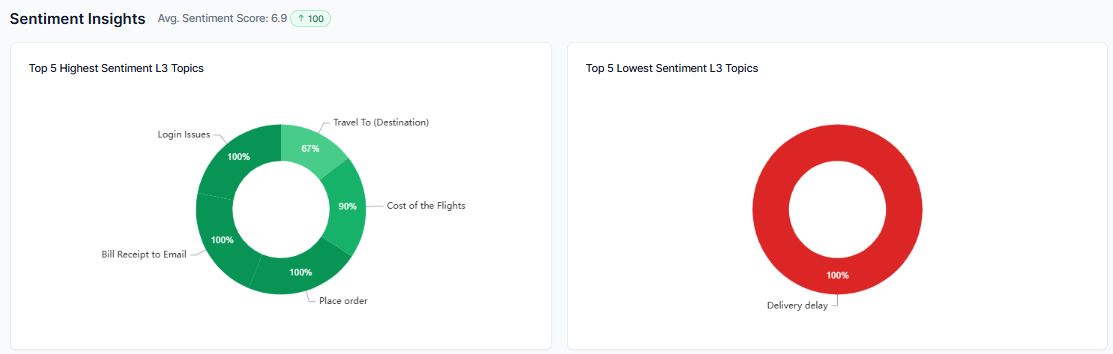
Resolution Insights
Shows how well the agent resolves customer issues.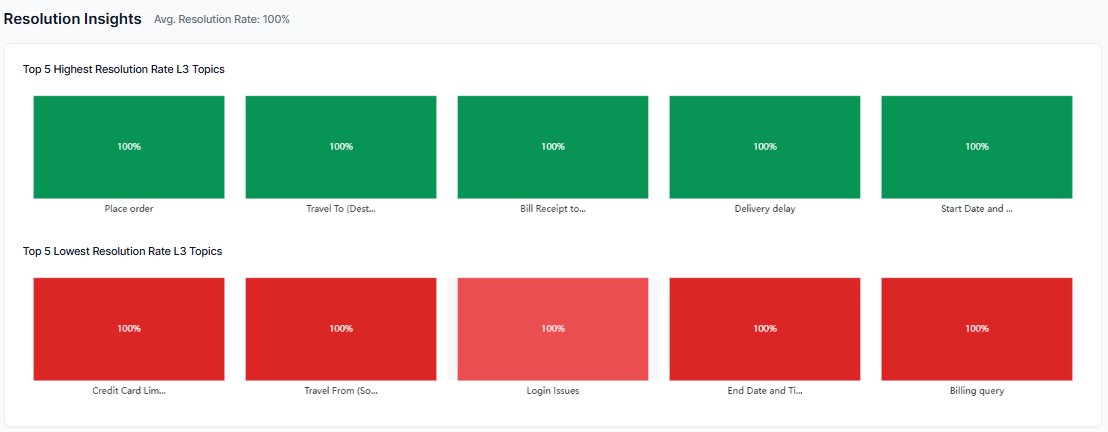
- Green: Positive sentiment
- Red: Negative sentiment
Scorecard Trend
Tracks agent performance trends over time based on selected scorecards and language preferences.Mark as Default
The system automatically selects the oldest assigned scorecard by default. Agents can switch scorecards and compare performance across multiple scorecards.Language Configuration
Each scorecard supports its own language configuration with auto-selection for mapped languages.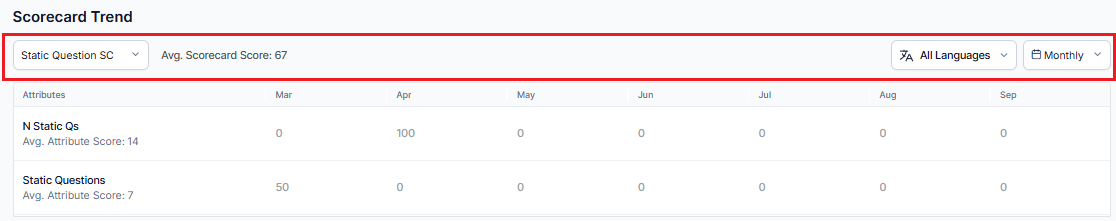
Trend Visualization with Time Ranges
The date range picker provides predefined time filters to analyze interaction data over selected periods, including the last 7, 28, and 90 days, or a custom range for more specific analysis. Trend visualization displays attribute-level scoring trends and the average scorecard based on the selected time range, using data from the current period.Scorecard Metrics
Evaluation Tab
This section displays completed agent interactions along with Date and Time, Queue, Auto QA Score (if available), Audit Score, and evaluation review status based on the user’s access settings.Access to Evaluation Tab
Navigate to Quality AI > My Dashboard > Evaluation.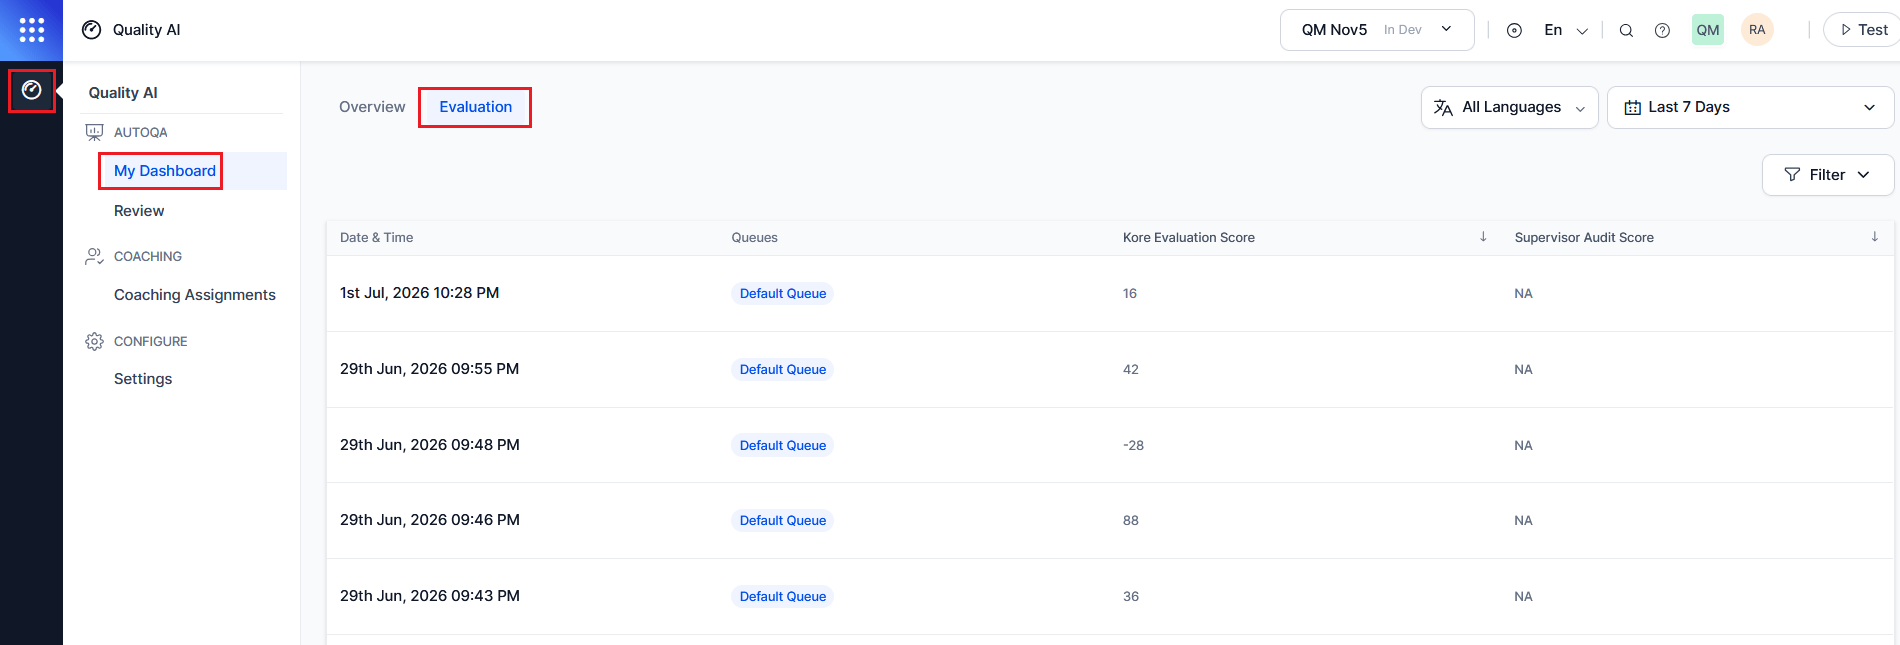
The Evaluation tab displays automated interaction scores only when the following are enabled in Quality AI > General Settings: Auto QA, Agent Scorecard, and Agent Access to Scored Interactions.
Filter
Filtering options vary based on the agent’s access level. Use the Queues filter to refine report results by selecting one or more queues to view associated interactions. Use the Audit Status filter to view interactions based on their audit state, with options for Audited (evaluated interactions) and Not Audited (unevaluated interactions). The filter panel displays the number of interactions that match the selected criteria, and selecting Apply updates the report results.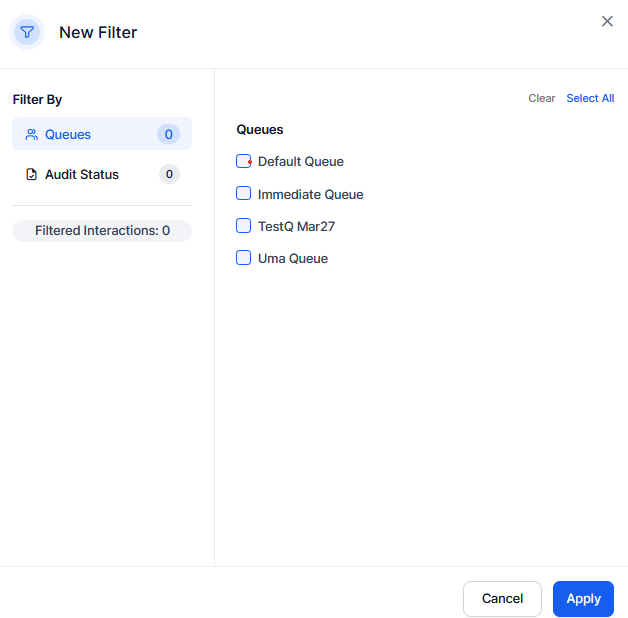
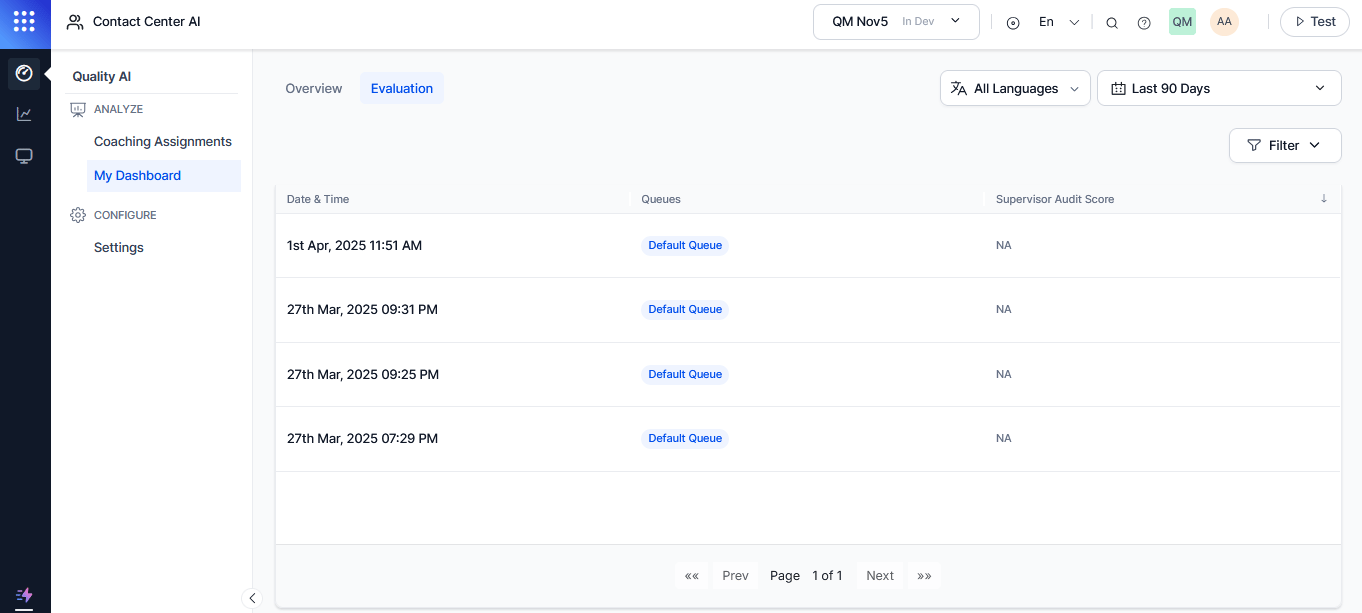
Available Interaction Views
The interactions displayed depend on the Agent Access to Scored Interactions configuration.-
Only Manually Audited Interactions: Displays supervisor-audited interactions with Date and Time, Queue, Supervisor Audit Score, Review Status, and Dispute Round.
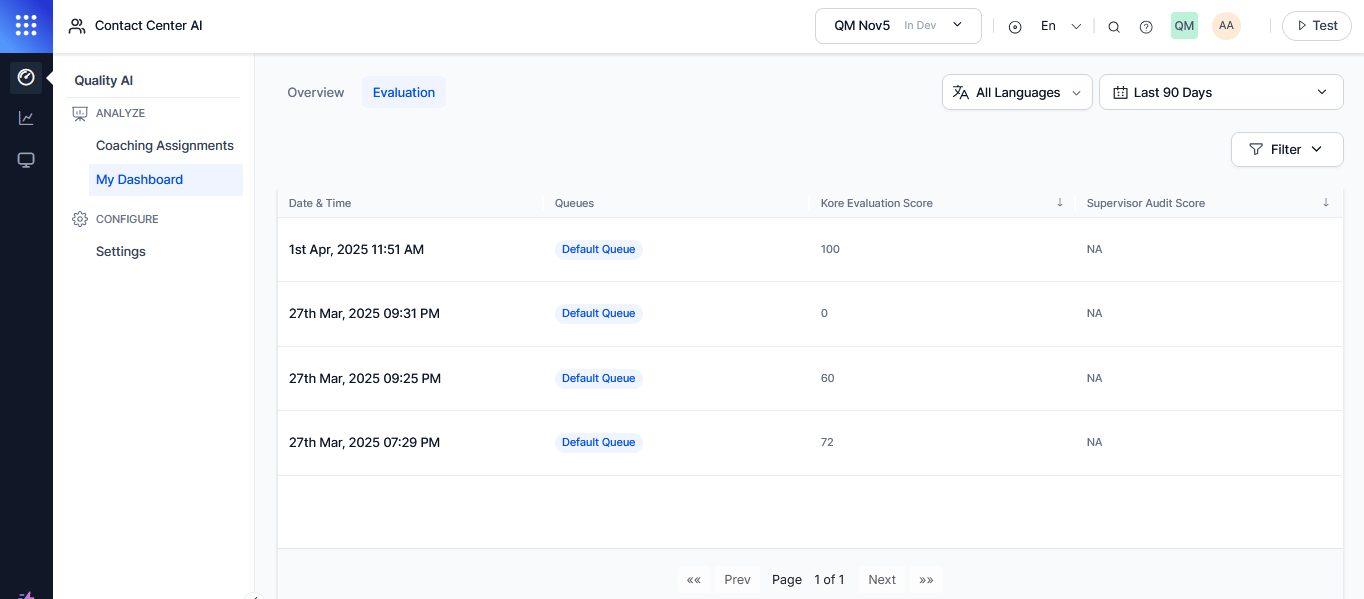
-
Manually Audited + Auto QA Scored Interactions: Displays interactions with Date and Time, Queue, Auto QA Score (Kore Evaluation Score), Supervisor Audit Score, Review Status, and Dispute Round.
Interaction Comments and Transcripts
- Agents can view transcripts and comments only for interactions assigned to them.
- In each interaction, the Audit tab displays comments within the Transcript section for each interaction.
-
Dispute comments submitted by the agent and QA responses display in the Comments and Dispute for each metric.
 Users with the Download Conversations permission can download conversation recordings directly from the audit screen. This permission is available by default to App Owner, App Developer, App Tester, and Supervisor roles.
Review
The Review page gives agents a dedicated view of all their manually evaluated conversations, grouped by review state. Agents can track evaluations awaiting action, monitor active disputes, and view completed or closed dispute outcomes from one place.Access Review Tabs
Navigate to Quality AI > Review.Review Tabs
Tabs represent the different evaluation groupings available in the Review tab.Review Status Values
The Review Status column reflects the current acknowledgment or dispute state for each manually evaluated conversation. Review Status values display only when Agent Accept & Dispute is enabled in Quality AI > Settings > Quality AI General Settings and disputes are configured for the evaluation form. Evaluations on forms with disputes disabled don’t display a Review Status.
Evaluation Filters
Review Status Values
The Review Status column shows the current acknowledgment or dispute state for each manually evaluated conversation.Review Status values display only when Agent Accept & Dispute is enabled in Quality AI > Settings > Quality AI General Settings and disputes are configured for the evaluation form. Evaluations with disputes disabled don’t display a Review Status.
Responding to an Evaluation
When an agent opens a conversation from the Pending Review tab, the audit screen displays each metric with the evaluator’s score, outcome, and notes or criteria. Agents review each metric individually and choose a response. To respond to an evaluation,- Select a conversation from the Pending Review tab to open the audit screen.
- For each metric, review the outcome and the evaluator’s notes.
- Select Accept to acknowledge the score, or Dispute to contest it.
- For any disputed metric, add a comment explaining the reason for the dispute.
- Agents can accept some metrics and dispute others within the same evaluation — they don’t need to contest the evaluation as a whole.
- Select Submit to send the response.
If one or more disputed metrics are missing comments. Add comments to all disputed metrics to continue.
After submission, the system routes the disputed metrics to the assigned QA for re-evaluation according to the form’s routing rules. The evaluation status changes to Awaiting QA Response.
Pending Review Tab
Disputes Tab
The Disputes menu item is visible only for users with Agent Dashboard permission when Agent Accept & Dispute is enabled in Quality AI > Settings > Quality AI General Settings and disputes are configured for at least one evaluation form.
Reviewing a QA Re-evaluation Response
When a QA completes their re-evaluation, the evaluation status changes to Re-evaluation Received. The agent can: The agent can:- Open the conversation from the Disputes tab.
- Review the QA’s revised score and written response per disputed metric in the Comments and Dispute section.
- Select Accept to close the dispute, or Dispute to raise a further dispute if the form permits additional rounds.
Disputes
The Disputes tab provides agents with a single view of all evaluations they have actively disputed, including the current round, QA response status, and auditor details.Access Disputes
The Disputes menu item is visible only for users with Agent Dashboard permission when Agent Accept & Dispute is enabled in Quality AI > Settings > Quality AI General Settings and disputes are configured for at least one evaluation form.
Disputes Attributes
Review Status Values (Disputes View)
When Hide Auditor Details is enabled at the app level, the Auditor column anonymizes the QA’s name.
Dispute Restrictions and Limitations
When Further Disputes Are Disabled
When the evaluation form disables multi-round re-disputes, agents see a clear in-context message on the re-evaluation screen explaining that the QA’s decision is final and further disputes aren’t permitted. No dispute option is available after this message. When you enable further disputes, the system sets the maximum number of rounds at the form level (for example, default: 3). Once the evaluation reaches the maximum number of rounds, the system automatically closes the dispute and updates the evaluation status to Closed.When Disputes Are Disabled at the Form Level
If you disable disputes for the evaluation form associated with a conversation, the system prevents agents from commenting on, accepting, or disputing any metric for that evaluation. The system does not display the metric-level Accept and Dispute buttons, and it shows the evaluation as Audited with no Review Status.Resolved Tab
The Resolved tab displays completed evaluation reviews along with the evaluation date, associated queues, final supervisor audit score, dispute rounds, and review status.Review Filter
The Review Status column reflects the current acknowledgement or dispute state for each manually evaluated conversation. Review Status values display only when Agent Accept & Dispute is enabled in Quality AI > Settings and the evaluation form has disputes configured. Evaluations on forms with disputes disabled don’t display a Review Status.
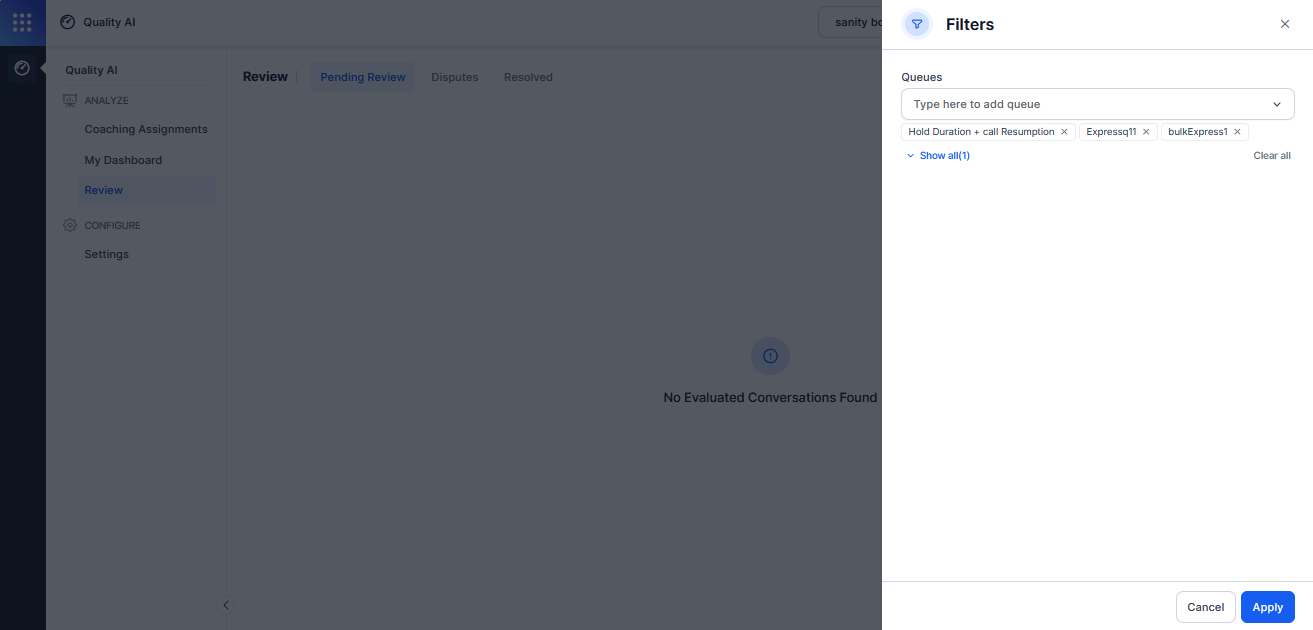
Evaluation Filters
Review Filter
The Queues filter helps you to refine evaluations by selecting one or more queues. It supports multi-select search, enabling users to find and apply relevant queue filters to narrow down the displayed evaluation results and assist with queue filtering and dispute tracking.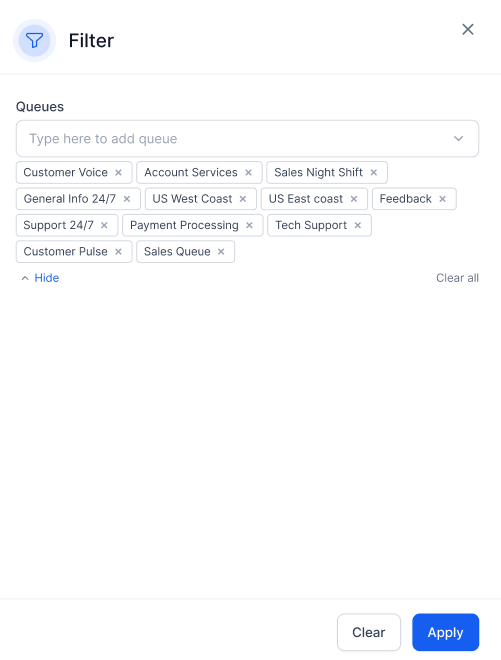
Note: The Review screen is available only when Agent Accept & Dispute is enabled in Quality AI > Settings and at least one evaluation form has disputes configured. If the setting is off or no forms have disputes enabled, the Review screen isn’t accessible.
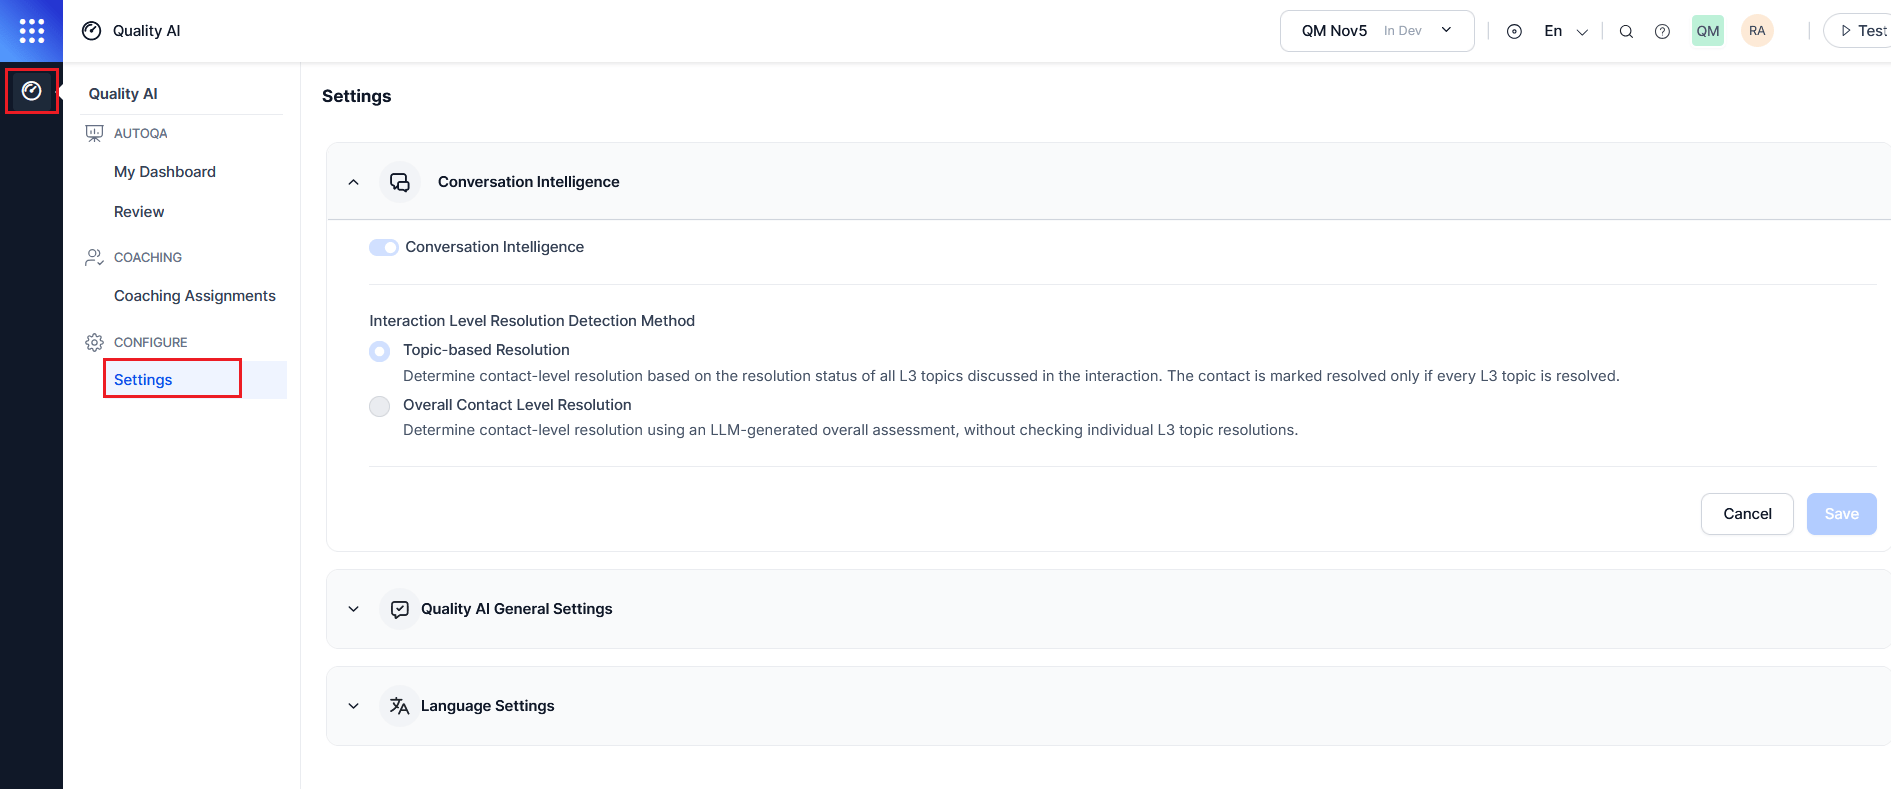
Settings
The Settings page displays all available options in view-only mode.