
Documentation Index

Fetch the complete documentation index at: https://koreai.mintlify.app/llms.txt

Use this file to discover all available pages before exploring further.

The Engagement dashboard helps you understand how users interact with Search AI. It provides visibility into search activity, answer effectiveness, user engagement trends, and response latency. Use this dashboard to analyze user engagement patterns, measure answer effectiveness and retrieval and response performance. To access the Engagement dashboard:
  1. Navigate to Analytics.
  2. Under Search AI, select Engagement.
Engagement Analytics

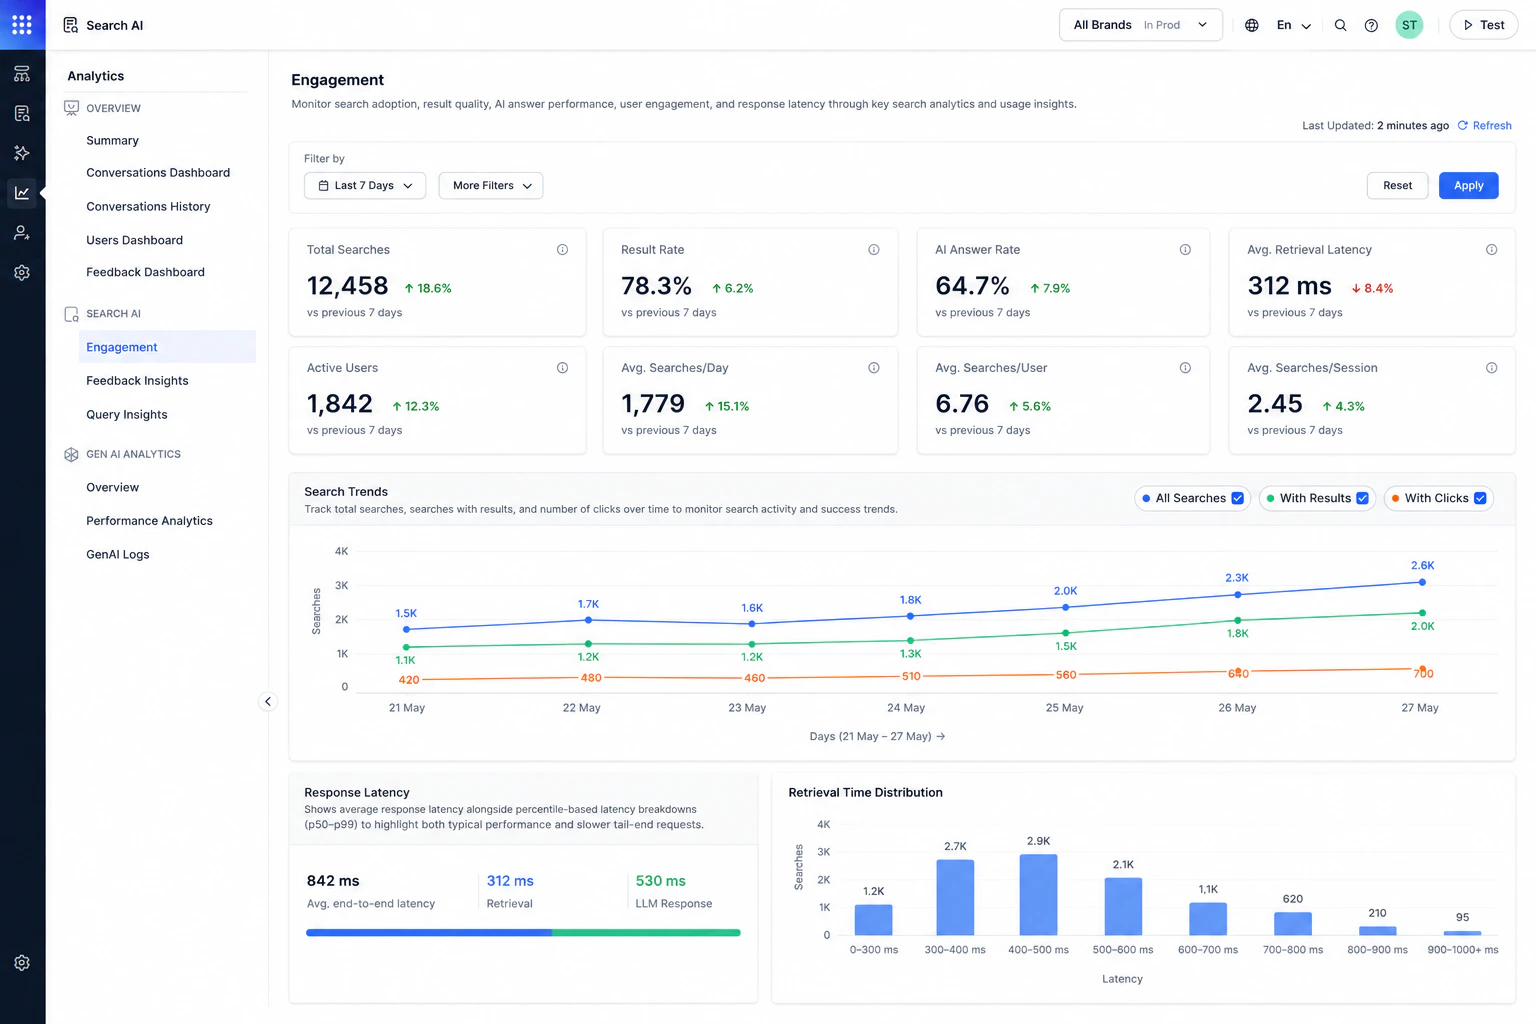
Key Engagement Metrics

MetricDescription
Total SearchesTotal number of searches performed during the selected period.
Result RatePercentage of searches that returned results.
AI Answer RatePercentage of AI searches that generated valid AI answers.
Avg. Retrieval LatencyAverage time taken to retrieve search results.
Active UsersNumber of unique users who performed searches.
Avg. Searches/DayAverage number of searches performed per day.
Avg. Searches/UserAverage number of searches performed by each user.
Avg. Searches/SessionAverage number of searches performed within a session.
The Search Trends chart helps visualize search activity over time. The chart displays:
  • All searches.
  • Searches with results.
  • Searches with clicks.
Use this chart to identify peak usage periods, analyze search adoption trends, compare successful searches against total searches and monitor click engagement over time. You can toggle individual trend lines on or off from the legend.

Response Latency

The Response Latency section helps monitor search response performance. This section includes:
  • Average end-to-end latency
  • Retrieval latency
  • LLM response latency
Use these metrics to:
  • Identify slow response patterns.
  • Monitor overall answer performance.
  • Analyze retrieval and generation delays.

Retrieval Time Distribution

The Retrieval Time Distribution chart shows how searches are distributed across latency ranges. Use this chart to:
  • Understand typical retrieval performance.
  • Identify slow-performing searches.
  • Monitor latency consistency across requests.