Dashboard Filters
The Agent AI Dashboard lets you filter data by time period and channel.Filter by Time Period
Select the Calendar icon at the top, choose an option from the list, and select Apply.Filter by Channel
By default, the dashboard shows the combined data for Voice, Chat, and Email. To filter by a specific channel, select All Channels in the top-right corner, and then select or clear channels from the dropdown list.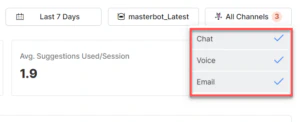
Widget Performance and Agent/Customer Behavior
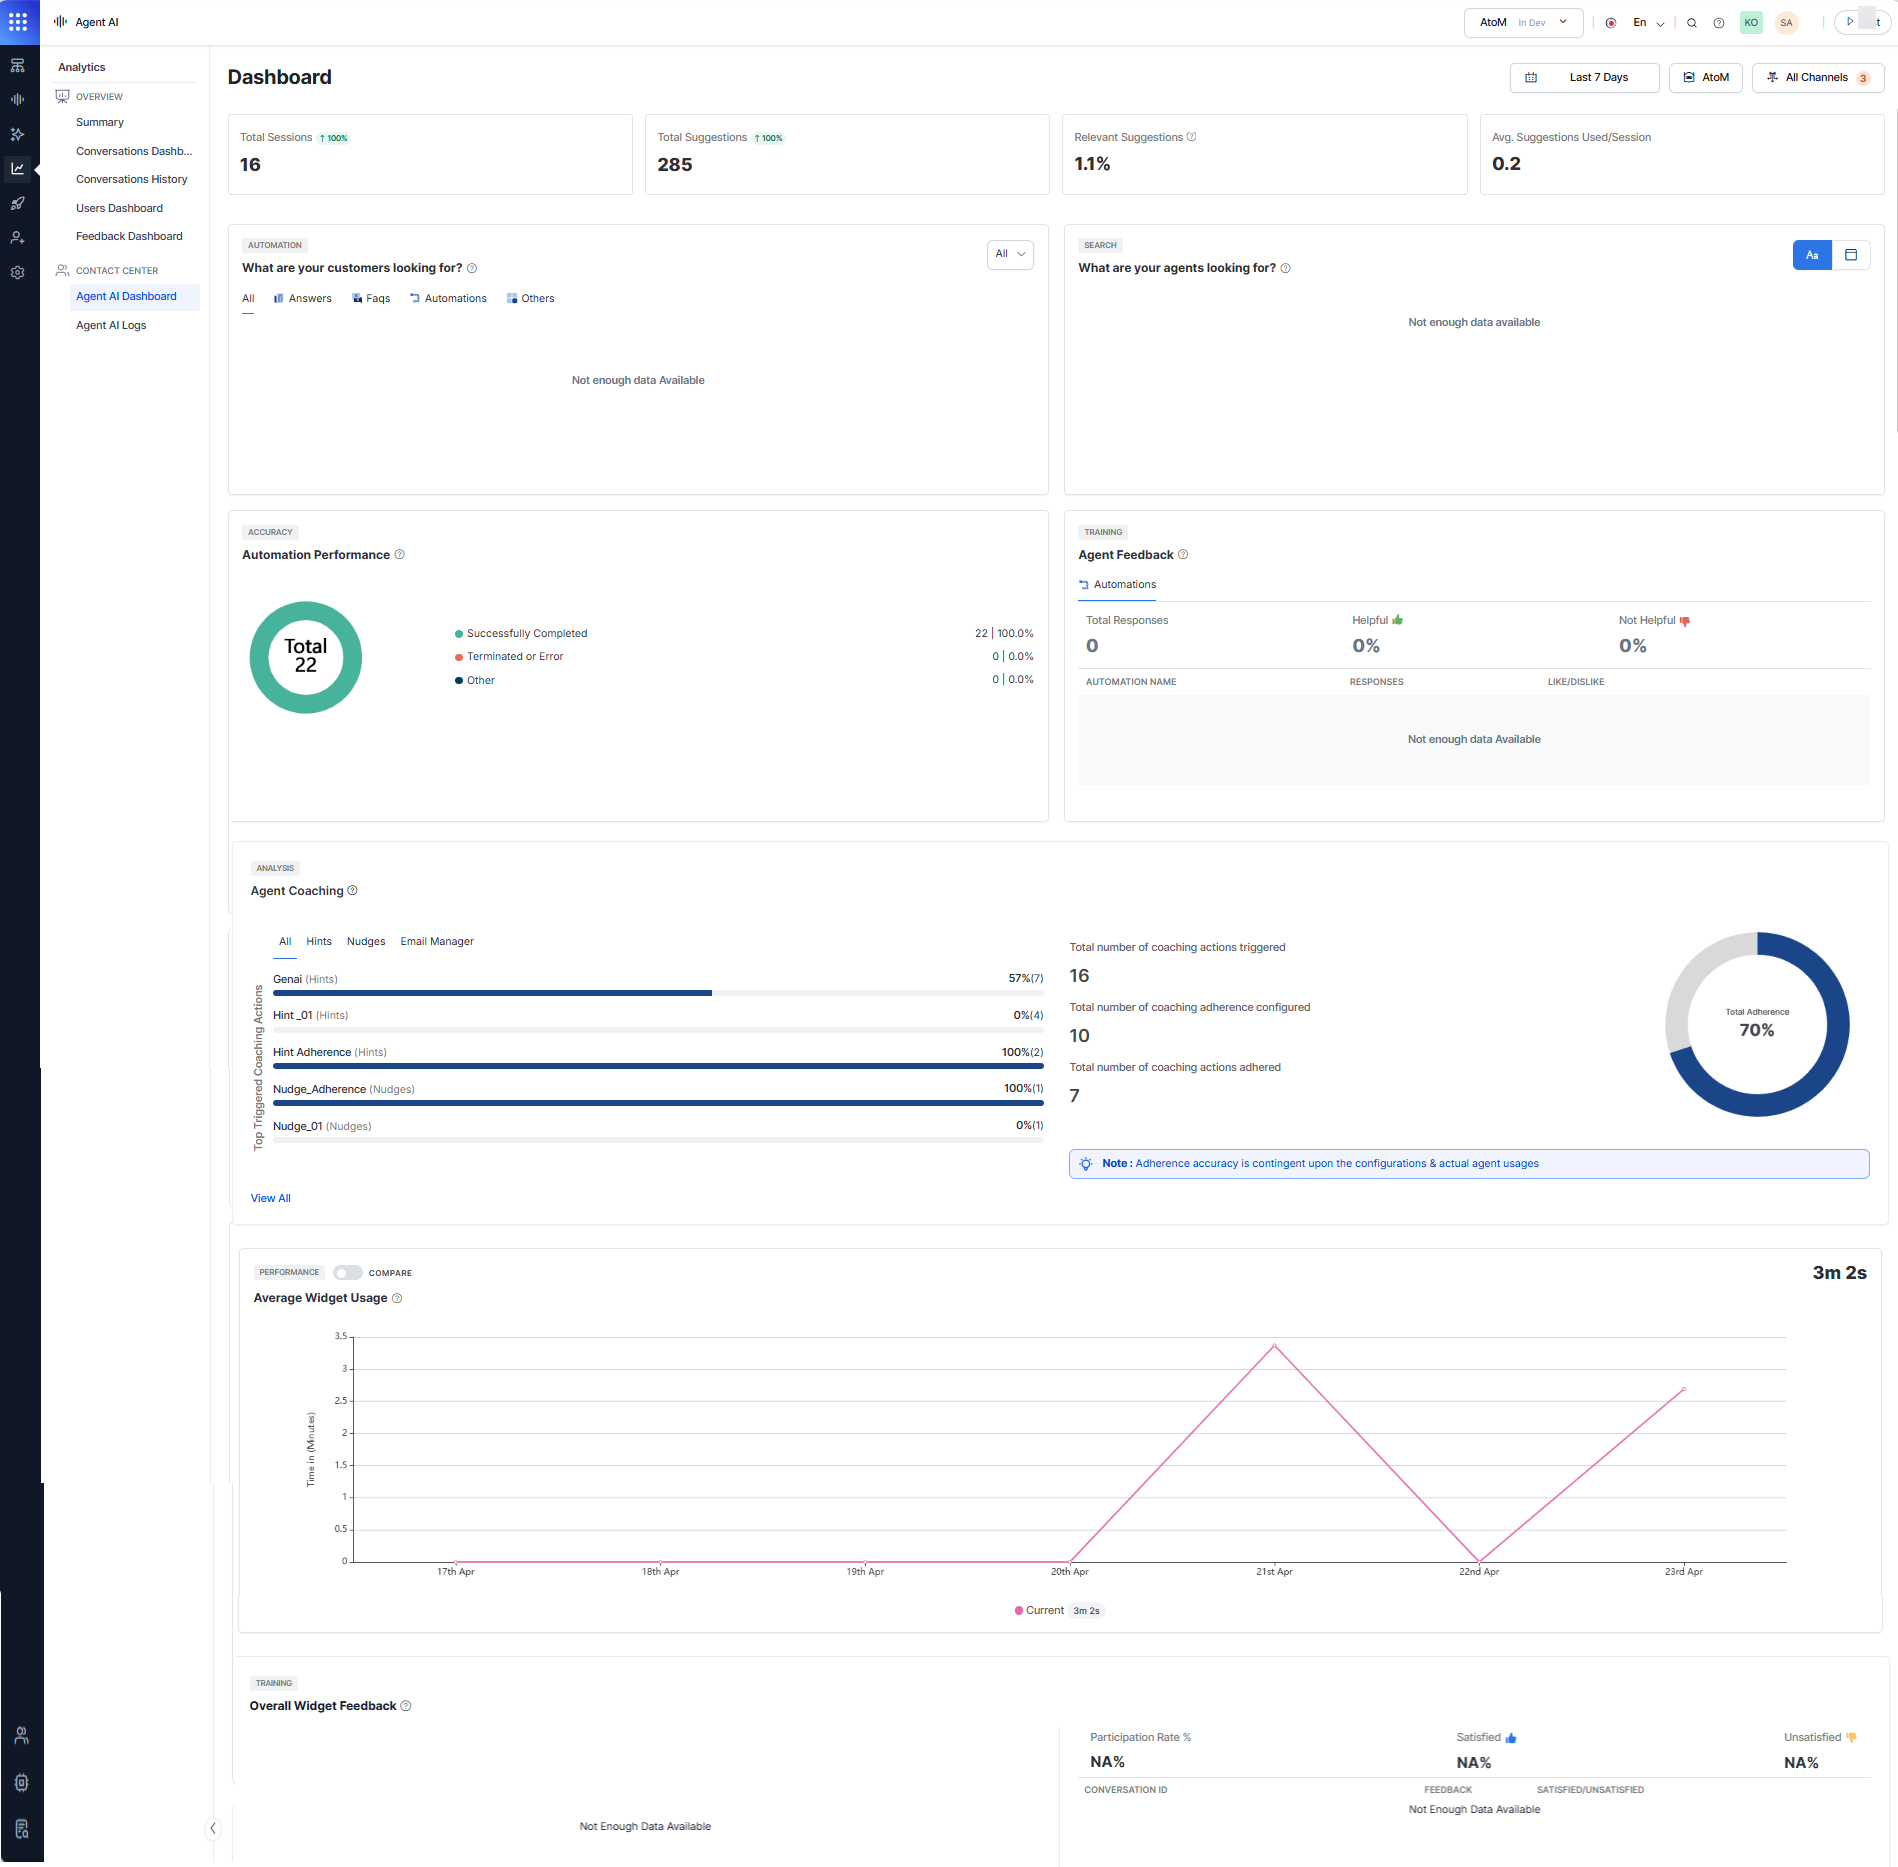
This section displays performance data for the Agent AI widget.Total Sessions
The total number of uninterrupted interactions between AI Agents and end users over a selected time period and channel. Each session is set to 15 minutes. If a session exceeds 15 minutes but is under 30 minutes, it counts as two sessions. A red percentage with a downward arrow indicates a decrease, while green with an upward arrow indicates an increase compared to the previous period.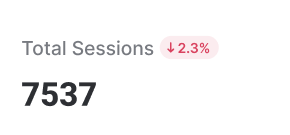
Total Suggestions
The total number of suggestions (such as “ask customer” and “tell customer”) the Agent AI widget provided to agents, including answers, automations, and FAQs. The red and green percentages work the same way as in Total Sessions.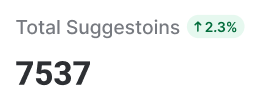
Relevant Suggestions
The percentage of widget suggestions that agents used. Calculated as: (Total suggestions used by agents / Total suggestions) × 100.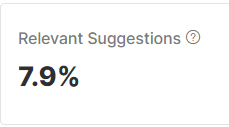
Average Suggestions Used per Session
The average number of suggestions used per session. Calculated as: Total Agent AI widget suggestions / Number of sessions.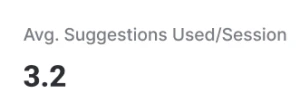
What Are Your Customers Looking For
This section shows which Answers, FAQs, Dialogue Tasks, web suggestions, and other data sources were used to fulfill customer needs, listed in popularity order. Filter data by All, Agent Initiated, or Agent AI Suggested. Use the tabs — All, Answers, FAQs, Automations, and Others — to view the top four items per category. Each item shows the number of times it was invoked and its percentage of total invocations for that tab.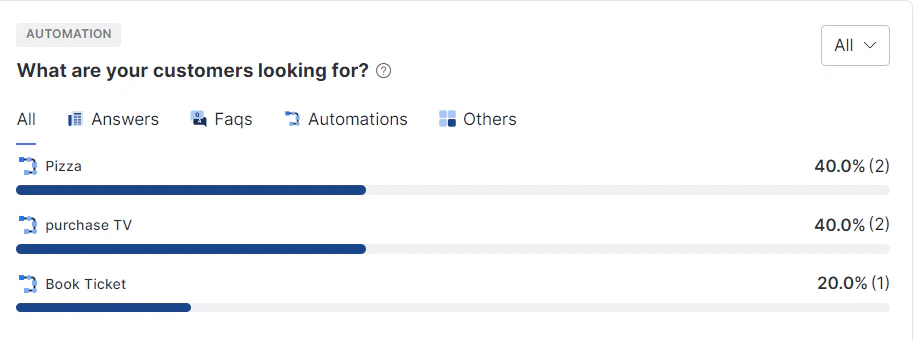
What Are Your Agents Looking For
This section shows what agents are searching for via the Ask a question search box. Every agent search is recorded. Total Search Requests shows the number of agent search requests. The green and red percentages work the same way as in Total Sessions. Data displays as a WordCloud by default, with an option to switch to Tabular form.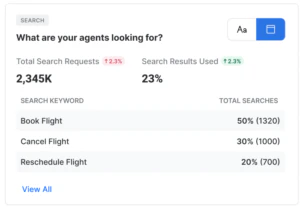
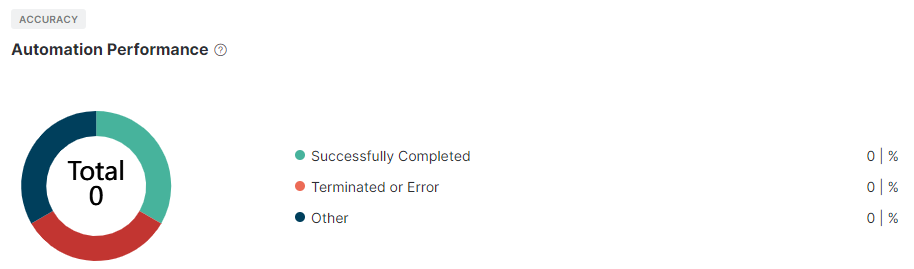
Automation Performance
This section shows the results (successfully completed, error encountered, terminated, and so on) of all Agent AI automations, represented in a pie chart.- The number at the center of the pie chart shows the total automation invocations.
- The chart is divided into three color-coded sections: Successfully Completed (green), Terminated or Error (red), and Other (dark blue).
- Hover over any section to see the top three automations for that result, with their invocation percentage.
- The right side shows the total count and percentage for each outcome.
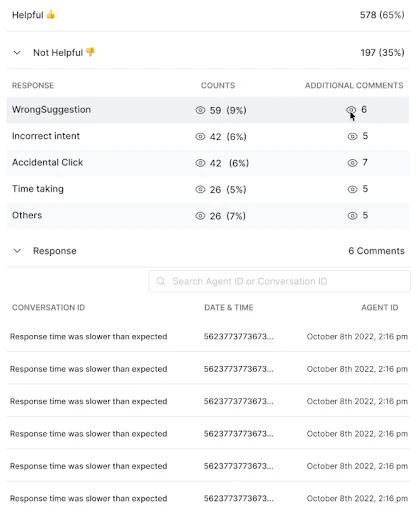
Agent Feedback
This section shows the top three most disliked automations by agents in descending order of dislike percentage. Agent AI captures likes and dislikes at the end of each dialog task. To review detailed feedback for a dialog task:- Select a dialog task under Automation Name.
- Select the eye icon under Additional Comments to view all comments linked to their conversation IDs.
- Select a Conversation ID link to open the corresponding conversation.
- Select the Counts number to view the Conversation ID, Date, Time, and Agent Name/ID.
- Use the search button to find conversations by agent name, agent ID, or conversation ID.
If the agent’s name is provided, the agent column is searchable; otherwise, the conversation ID is available.
Agent Coaching
The Agent Coaching section shows how coaching rules perform in the Agent Coaching section. Admins and supervisors can see how often coaching is triggered, how well agents adhered to it, and which rules are most active—across hints, nudges, and email manager actions.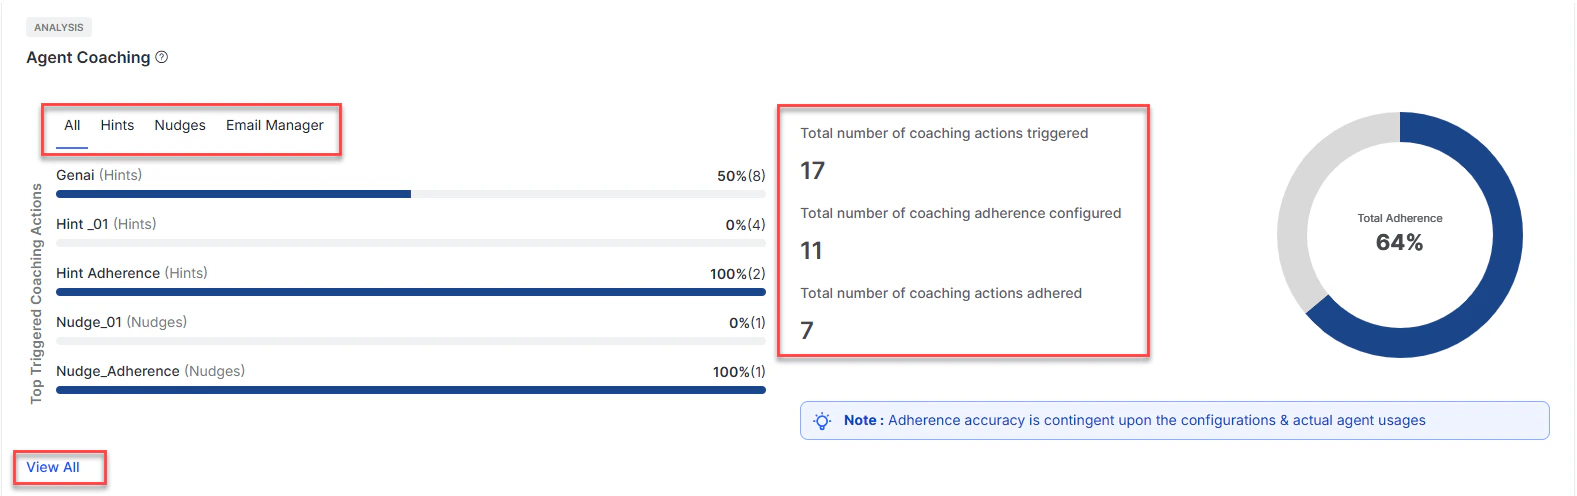
- Left—a chart listing the top triggered coaching actions for the selected period.
- Right—a summary panel showing the overall metrics across all coaching rules.
Top Triggered Coaching Actions
This chart lists the most-triggered coaching rules for the selected period. Each entry shows the rule name, coaching type, adherence percentage, and the number of times triggered (in parentheses). Use the tabs to filter by coaching type:
Select View All at the bottom of the chart to open the full coaching rule breakdown.
Summary Metrics
The panel on the right shows the following cumulative metrics for the selected period: Adherence accuracy depends on how coaching rules are configured and how agents use them.
View All — Coaching Rule Breakdown
Select View All from the overview page to open the full coaching rule breakdown. This screen lists every coaching rule that triggered during the selected period.Summary bar
At the top of the screen, two cumulative metrics display for the active tab:- Number of times triggered—total trigger count for all rules in the active tab.
- Overall Adherence %—combined adherence rate for the active tab, calculated as (Total times adhered ÷ Total times triggered) × 100.
Tabs
Use the tabs at the top to filter by coaching type. The summary bar and rule table both update when you switch tabs.Coaching rule table
This table lists all coaching rules that match the active tab. The following columns display:Conditions and Exceptions
**Multiple Entries for a Coaching Rule: **A coaching rule can display as more than one row in the table. This happens in two scenarios: Scenario 1: Multiple trigger types in one rule If a coaching rule has more than one trigger type configured (for example, a hint and a nudge), the table displays a separate row for each trigger type, each with its own adherence percentage. Example: Coaching Rule 1 has both a Hint and a Nudge configured. If both have triggered, the table displays:- Coaching Rule 1 — Hint — Adherence % for Hint
- Coaching Rule 1 — Nudge — Adherence % for Nudge
- Date range covers both periods: two rows display—one for Utterance, one for Gen AI Utterance.
- Date range falls within one period: one row displays.
Average Widget Usage (Third-Party Agent Desktop)
This feature shows a graphical representation of the average time agents spend on the Agent AI widget. It applies only to third-party agent desktops. Use the Compare button to compare selected period data using an “n-1” formula. For example, selecting “30 days” compares the last 30 days with the previous 30 days.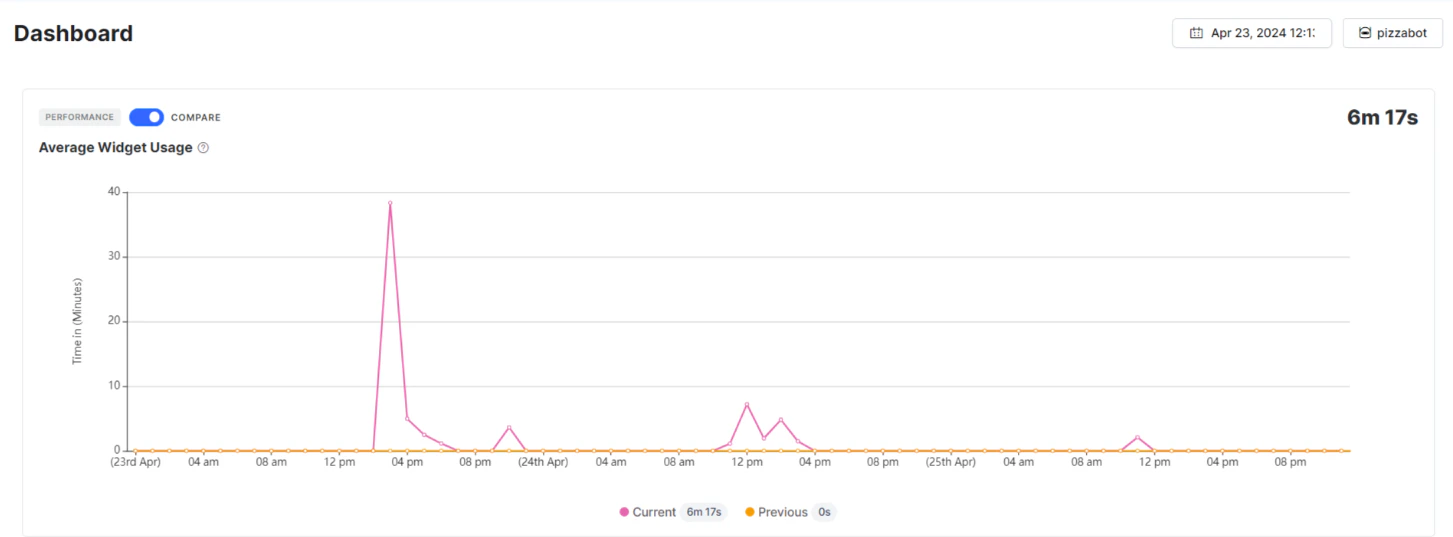
Overall Widget Feedback
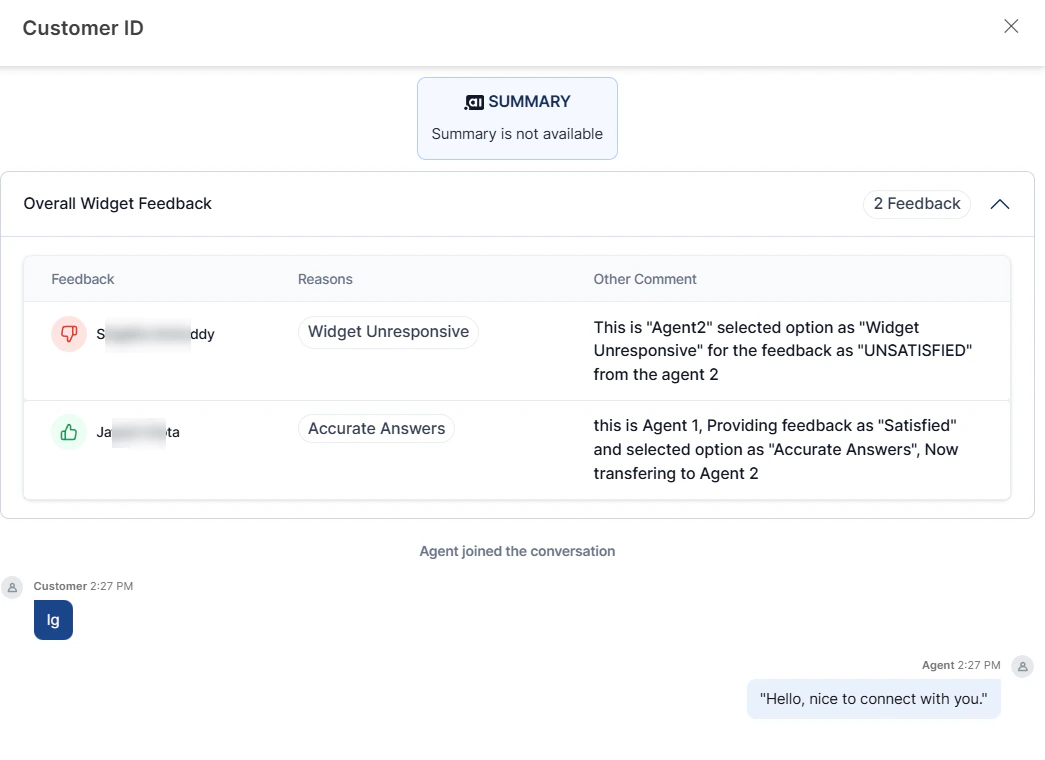
The Overall Widget Feedback section summarizes agent feedback on the Agent AI widget, including Total Feedback, Participation Rate, and Satisfied versus Unsatisfied percentages. At the conversation level, it shows agent names, feedback reasons, comments, and transcripts. Administrators can use this to monitor agent experience, identify strengths, and prioritize improvements.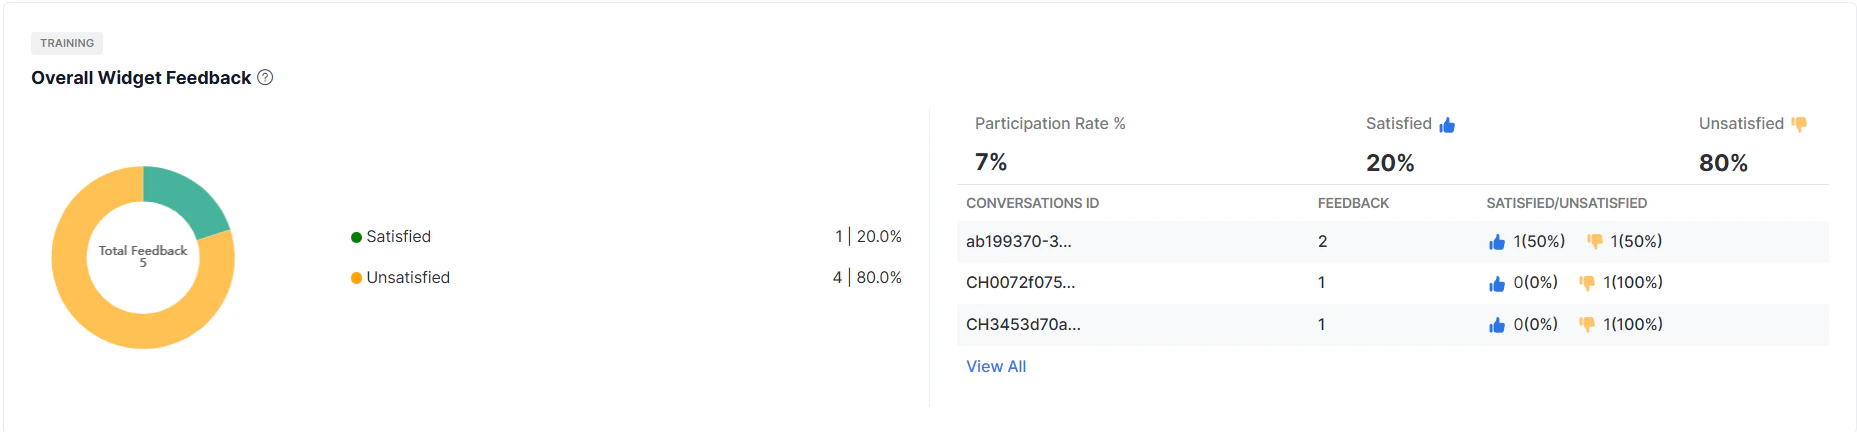
-
Left section: Shows the total number of agent feedback responses for the selected period, with satisfied and unsatisfied counts and percentages. Hover over the color-coded chart (yellow for unsatisfied, green for satisfied) to view details.
- Unsatisfied (%) = (Total unsatisfied feedback / Total feedback) × 100
- Satisfied (%) = (Total satisfied feedback / Total feedback) × 100
-
Top-right section: Shows Participation Rate, Satisfied, and Unsatisfied percentages. Multiple feedback entries for the same conversation count as one for the Participation Rate.
- Participation Rate (%) = (Conversations with feedback / Total conversations) × 100
-
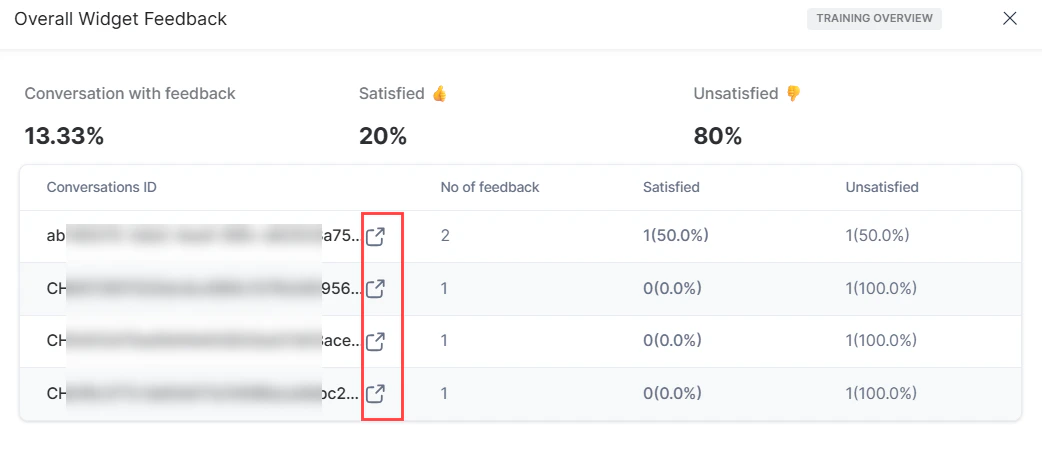
Bottom section: Lists conversation IDs, number of agent feedback responses, and satisfied/unsatisfied percentages per conversation.
- Select the external link icon next to a conversation ID to view its details.