> ## Documentation Index
> Fetch the complete documentation index at: https://koreai.mintlify.site/llms.txt
> Use this file to discover all available pages before exploring further.
# Agent AI Analytics Performance
[Back to Analytics Overview](/ai-for-service/analytics/overview)
The **Performance** section gives supervisors and administrators a date and channel-filtered view of Agentic Copilot suggestion acceptance rates and average summary generation times.
## Access Performance
1. Sign in to **AI for Service**.
2. Go to **Agent AI** > **Analytics**.
3. Select **Agent AI** > **Performance**.
4. Filter data based on the following table:
| **Filter** | **Description** |
| -------------- | --------------------------------------------------------------------------------------- |
| **Date range** | Filters all metrics by the selected time period. Defaults to **Today**. |
| **Channels** | Filters data by channel — **Chat**, **Voice**, **Email**. Defaults to **All Channels**. |
 ## Session and suggestion metrics
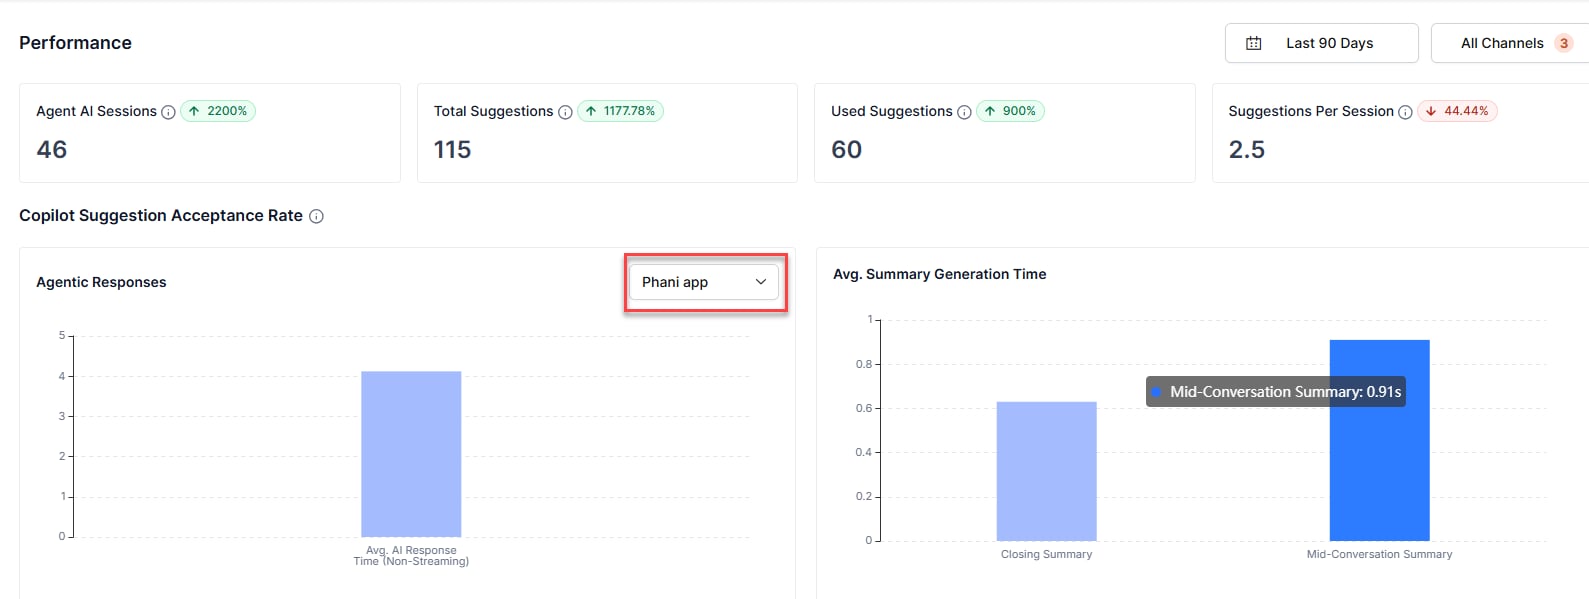
The top of the **Performance** section shows four summary metrics for the selected date range. Each metric card includes a delta indicator (↑ or ↓) that compares the current period against the previous equivalent period.
| **Metric** | **Description** |
| --------------------------- | ---------------------------------------------------------------------- |
| **Agent AI Sessions** | Total Agent AI widget sessions across the selected time range. |
| **Total Suggestions** | Total Agentic Copilot suggestions shown to agents across all sessions. |
| **Used Suggestions** | Total suggestions agents used — copied or sent — across all sessions. |
| **Suggestions Per Session** | Average number of suggestions per session. |
### Copilot Suggestion Acceptance Rate
This section displays two panels side by side: **Agentic Responses** and **Avg. Summary Generation Time**.
#### Agentic Responses
The **Agentic Responses** panel displays a bar chart of the average AI response time (non-streaming) for the selected Agentic app. Use the dropdown list to switch between configured Agentic apps. Hover over a bar to view the exact value in seconds.
| **Element** | **Description** |
| ----------------------------------------- | ------------------------------------------------------------------------------------------- |
| **App dropdown list** | Filters the chart by the selected Agentic app. |
| **Avg. AI Response Time (Non-Streaming)** | Average time the system takes to generate a non-streaming AI response for the selected app. |
#### Avg. Summary Generation Time
The **Avg. Summary Generation Time** panel displays a bar chart comparing the average generation time for **Closing Summary** and **Mid-Conversation Summary** across the selected date range. Hover over a bar to view the exact value in seconds.
| **Metric** | **Description** |
| ---------------------------- | --------------------------------------------------------------------- |
| **Closing Summary** | Average time, in seconds, to generate an end-of-conversation summary. |
| **Mid-Conversation Summary** | Average time, in seconds, to generate a mid-conversation summary. |
## Session and suggestion metrics
The top of the **Performance** section shows four summary metrics for the selected date range. Each metric card includes a delta indicator (↑ or ↓) that compares the current period against the previous equivalent period.
| **Metric** | **Description** |
| --------------------------- | ---------------------------------------------------------------------- |
| **Agent AI Sessions** | Total Agent AI widget sessions across the selected time range. |
| **Total Suggestions** | Total Agentic Copilot suggestions shown to agents across all sessions. |
| **Used Suggestions** | Total suggestions agents used — copied or sent — across all sessions. |
| **Suggestions Per Session** | Average number of suggestions per session. |
### Copilot Suggestion Acceptance Rate
This section displays two panels side by side: **Agentic Responses** and **Avg. Summary Generation Time**.
#### Agentic Responses
The **Agentic Responses** panel displays a bar chart of the average AI response time (non-streaming) for the selected Agentic app. Use the dropdown list to switch between configured Agentic apps. Hover over a bar to view the exact value in seconds.
| **Element** | **Description** |
| ----------------------------------------- | ------------------------------------------------------------------------------------------- |
| **App dropdown list** | Filters the chart by the selected Agentic app. |
| **Avg. AI Response Time (Non-Streaming)** | Average time the system takes to generate a non-streaming AI response for the selected app. |
#### Avg. Summary Generation Time
The **Avg. Summary Generation Time** panel displays a bar chart comparing the average generation time for **Closing Summary** and **Mid-Conversation Summary** across the selected date range. Hover over a bar to view the exact value in seconds.
| **Metric** | **Description** |
| ---------------------------- | --------------------------------------------------------------------- |
| **Closing Summary** | Average time, in seconds, to generate an end-of-conversation summary. |
| **Mid-Conversation Summary** | Average time, in seconds, to generate a mid-conversation summary. |