

-
Click Analytics on the left navigation pane. The Analytics panel opens with the list of reports.
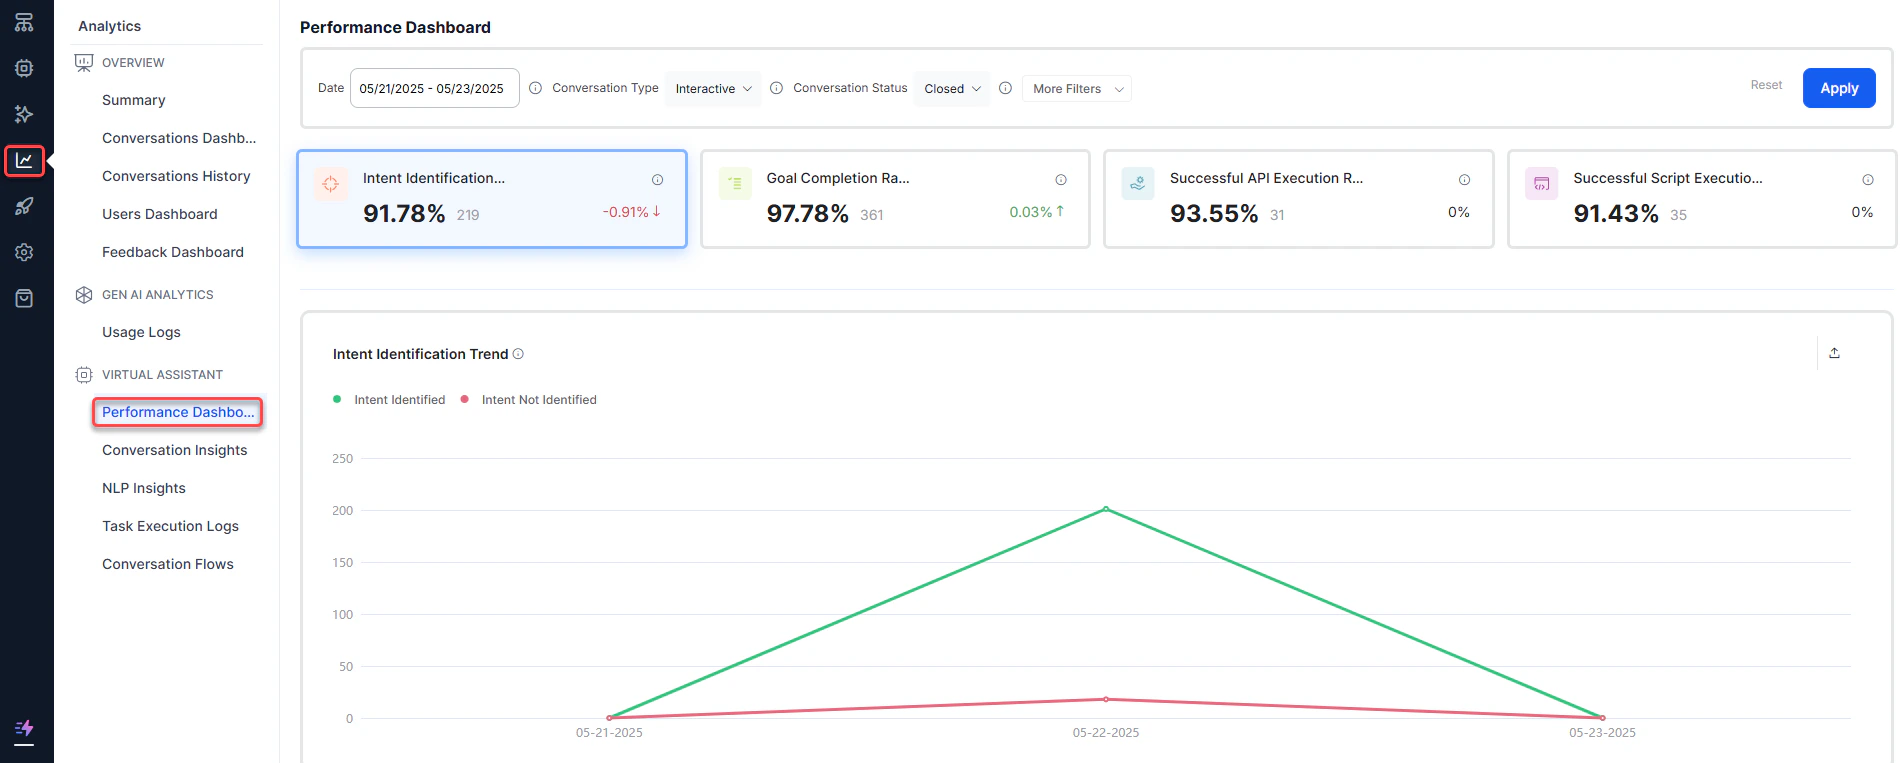
- Click Performance Dashboard under the Automation section of the Analytics panel.
-
Select appropriate filters and click Apply.
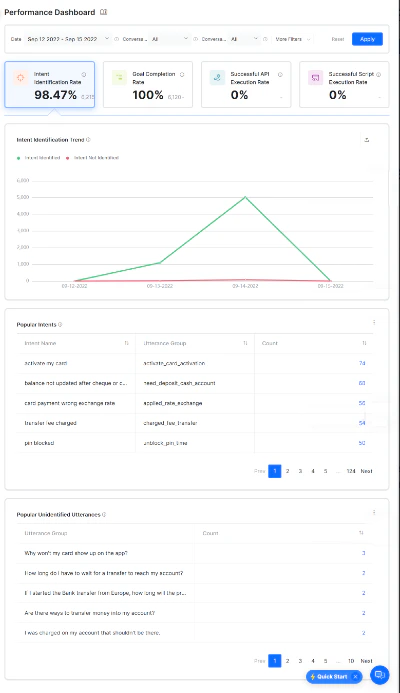
Performance Dashboard
Back to Analytics Overview
The Performance Dashboard provides insights into your AI Agent’s NLP performance and integration metrics after it’s published.
To view the Performance Dashboard: