> ## Documentation Index
> Fetch the complete documentation index at: https://koreai.mintlify.site/llms.txt
> Use this file to discover all available pages before exploring further.
# Analytics Pipelines
This document covers the pipeline framework in Analytics and Insights: the built-in pipelines that power Agent Performance, Quality Monitor, and Customer Insights, and the visual node-based editor for building custom evaluation logic.
Navigation: **Project** → **Insights** → **Pipelines**
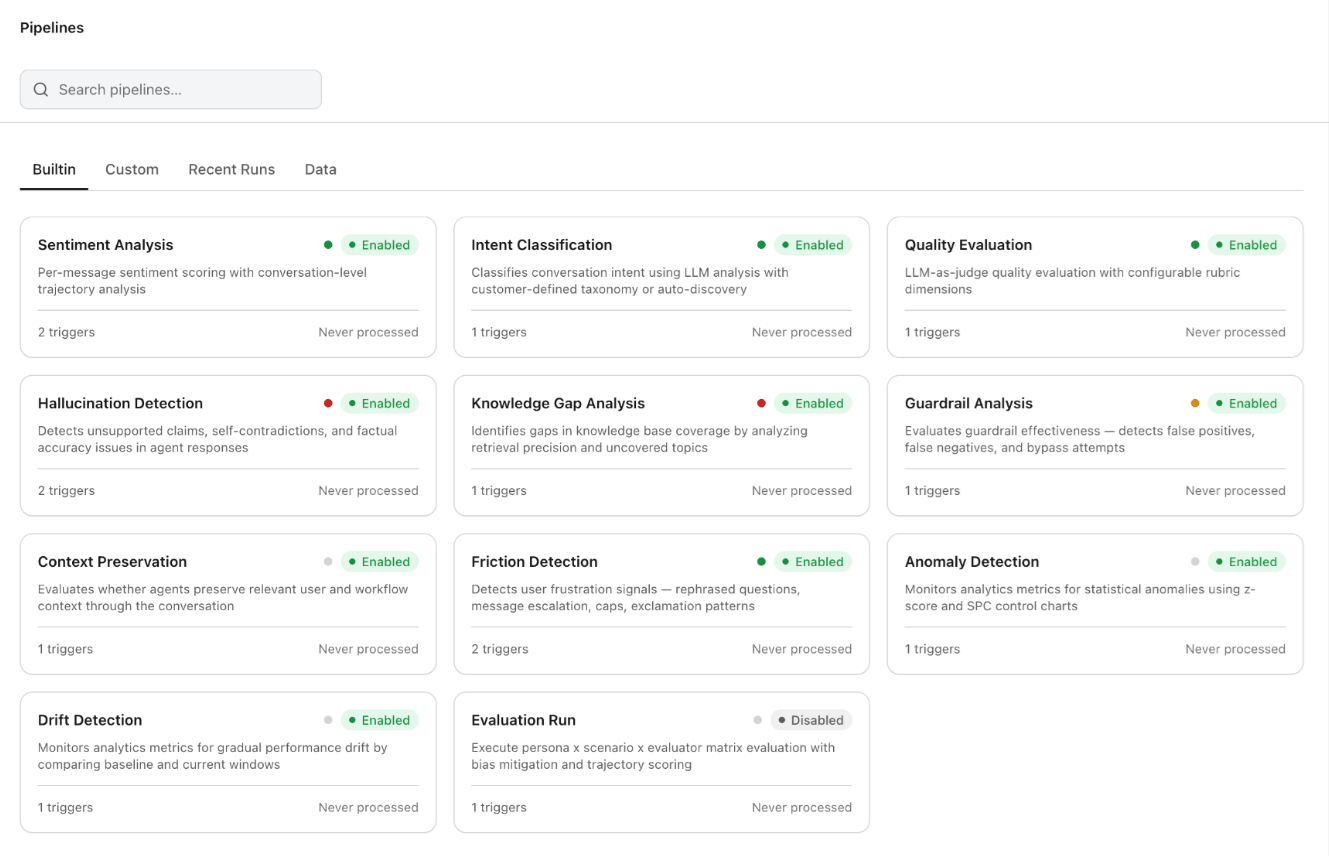
Each pipeline card displays its name, description, enabled/disabled status (green "Enabled" badge or gray "Disabled" badge), trigger count, and last processed timestamp (or "Never processed" if the pipeline hasn't run yet). Use the search bar at the top to find pipelines by name.
 ## Sections
| Section | Purpose |
| --------------- | ---------------------------------------------------------------------------------------------------------- |
| **Built-in** | Pre-configured pipelines that ship with the platform, ready to enable with a single toggle. |
| **Custom** | User-defined processing workflows created using the visual pipeline editor. |
| **Recent Runs** | Pipeline execution history with timestamps, durations, status (success/failure), and links to output data. |
| **Data** | Pipeline output data available for dashboard integration, export, and downstream consumption. |
## Built-in Pipelines
The platform ships with eleven pre-built pipelines covering evaluation, classification, detection, and monitoring needs. Enable each pipeline with a single toggle — no configuration required for the defaults.
| Pipeline | Description |
| --------------------------- | ------------------------------------------------------------------------------------------------------------------------------------------------------------- |
| **Sentiment Analysis** | Per-message sentiment scoring with conversation-level trajectory analysis. Feeds the Sentiment Trajectory chart in Customer Insights. |
| **Intent Classification** | Classifies conversation intent using LLM analysis with customer-defined taxonomy or auto-discovery. Feeds the Intent Distribution chart in Customer Insights. |
| **Quality Evaluation** | LLM-as-judge quality evaluation with configurable rubric dimensions. Feeds the Quality Score in Agent Performance and Quality Monitor. |
| **Hallucination Detection** | Detects unsupported claims, self-contradictions, and factual accuracy issues in agent responses. |
| **Knowledge Gap Analysis** | Identifies gaps in knowledge base coverage by analyzing retrieval precision and uncovered topics. |
| **Guardrail Analysis** | Evaluates guardrail effectiveness — detects false positives, false negatives, and bypass attempts. |
| **Context Preservation** | Evaluates whether agents preserve relevant user and workflow context through the conversation. |
| **Friction Detection** | Detects user frustration signals — rephrased questions, message escalation, caps, and exclamation patterns. |
| **Anomaly Detection** | Monitors analytics metrics for statistical anomalies using z-score and SPC (Statistical Process Control) charts. |
| **Drift Detection** | Monitors analytics metrics for gradual performance drift by comparing baseline and current windows. |
| **Evaluation Run** | Executes persona × scenario × evaluator matrix evaluation with bias mitigation and trajectory scoring. |
## Custom Pipelines
Custom pipelines let you define your own analytics logic using a visual, drag-and-drop node-based editor. Use custom pipelines to build organization-specific evaluation criteria that go beyond the built-in set — for example, regulatory compliance checks, brand voice adherence, or domain-specific accuracy scoring.
### How the Editor Works
The editor presents a visual canvas where you construct a pipeline as a directed graph of connected nodes. A **Node Palette** on the left side provides draggable node types organized into categories:
| Category | Node types |
| --------- | --------------------------------------------------------------------------------------------------------------- |
| **Data** | Read Conversation, Read Message Window, Aggregate, Database Query, Filter, Transform Data, Inspect Output |
| **Logic** | Sub-Pipeline (reuse an existing pipeline as a step), Wait for Event (pause execution until a named event fires) |
The core pattern: define a trigger, connect one or more processing nodes, then wire the output to a storage or metrics node.
## Sections
| Section | Purpose |
| --------------- | ---------------------------------------------------------------------------------------------------------- |
| **Built-in** | Pre-configured pipelines that ship with the platform, ready to enable with a single toggle. |
| **Custom** | User-defined processing workflows created using the visual pipeline editor. |
| **Recent Runs** | Pipeline execution history with timestamps, durations, status (success/failure), and links to output data. |
| **Data** | Pipeline output data available for dashboard integration, export, and downstream consumption. |
## Built-in Pipelines
The platform ships with eleven pre-built pipelines covering evaluation, classification, detection, and monitoring needs. Enable each pipeline with a single toggle — no configuration required for the defaults.
| Pipeline | Description |
| --------------------------- | ------------------------------------------------------------------------------------------------------------------------------------------------------------- |
| **Sentiment Analysis** | Per-message sentiment scoring with conversation-level trajectory analysis. Feeds the Sentiment Trajectory chart in Customer Insights. |
| **Intent Classification** | Classifies conversation intent using LLM analysis with customer-defined taxonomy or auto-discovery. Feeds the Intent Distribution chart in Customer Insights. |
| **Quality Evaluation** | LLM-as-judge quality evaluation with configurable rubric dimensions. Feeds the Quality Score in Agent Performance and Quality Monitor. |
| **Hallucination Detection** | Detects unsupported claims, self-contradictions, and factual accuracy issues in agent responses. |
| **Knowledge Gap Analysis** | Identifies gaps in knowledge base coverage by analyzing retrieval precision and uncovered topics. |
| **Guardrail Analysis** | Evaluates guardrail effectiveness — detects false positives, false negatives, and bypass attempts. |
| **Context Preservation** | Evaluates whether agents preserve relevant user and workflow context through the conversation. |
| **Friction Detection** | Detects user frustration signals — rephrased questions, message escalation, caps, and exclamation patterns. |
| **Anomaly Detection** | Monitors analytics metrics for statistical anomalies using z-score and SPC (Statistical Process Control) charts. |
| **Drift Detection** | Monitors analytics metrics for gradual performance drift by comparing baseline and current windows. |
| **Evaluation Run** | Executes persona × scenario × evaluator matrix evaluation with bias mitigation and trajectory scoring. |
## Custom Pipelines
Custom pipelines let you define your own analytics logic using a visual, drag-and-drop node-based editor. Use custom pipelines to build organization-specific evaluation criteria that go beyond the built-in set — for example, regulatory compliance checks, brand voice adherence, or domain-specific accuracy scoring.
### How the Editor Works
The editor presents a visual canvas where you construct a pipeline as a directed graph of connected nodes. A **Node Palette** on the left side provides draggable node types organized into categories:
| Category | Node types |
| --------- | --------------------------------------------------------------------------------------------------------------- |
| **Data** | Read Conversation, Read Message Window, Aggregate, Database Query, Filter, Transform Data, Inspect Output |
| **Logic** | Sub-Pipeline (reuse an existing pipeline as a step), Wait for Event (pause execution until a named event fires) |
The core pattern: define a trigger, connect one or more processing nodes, then wire the output to a storage or metrics node.
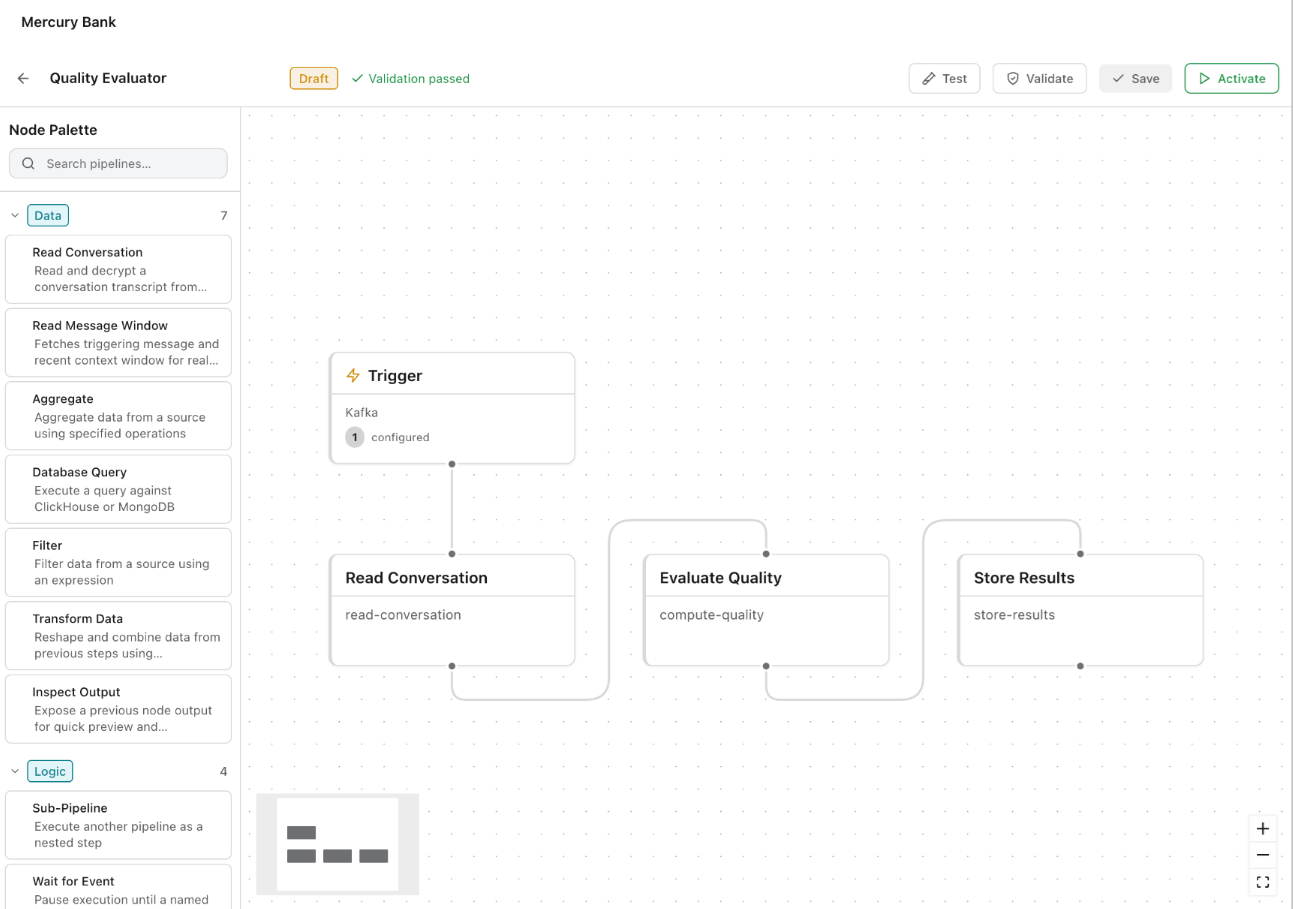 ### Pipeline Structure
| Component | Description |
| -------------------- | ----------------------------------------------------------------------------------------------------------------------------------------------------------------------------------------------------------------- |
| **Trigger** | Defines when the pipeline runs. Trigger types include Kafka events, scheduled intervals, in-platform events (for example, conversation completed), or filtered subsets of sessions. |
| **Processing nodes** | The evaluation and transformation logic applied to each triggered item. Nodes can read conversation data, query databases, aggregate metrics, filter records, transform data shapes, or call LLMs for evaluation. |
| **Metrics output** | The results the pipeline produces. Metrics take the form of named, typed values (counts, percentages, scores) that appear in the Data section and that you can wire into dashboards. |
### Pipeline Lifecycle
Pipelines follow a Draft → Validate → Test → Activate lifecycle. The editor toolbar shows the current state (Draft badge, "Validation passed" indicator) and provides buttons for Test, Validate, Save, and Activate. You can iterate on draft pipelines without disrupting live ones, save drafts as you go, validate to catch configuration errors before deployment, and run test executions to verify output before activating.
### Sub-Pipelines
You can reference one pipeline as a step inside another, enabling reuse and composability. For example, a "Compliance Evaluation" pipeline could call both the built-in "Guardrail Analysis" and a custom "Regulatory Wording Check" as sub-steps.
### Attaching to Dashboards
Once a custom pipeline produces data, its metrics appear alongside built-in metrics in **Agent Performance**, **Quality Monitor**, and **Customer Insights**, giving teams a single pane of glass across both standard and organization-specific evaluation.
Start with the built-in pipelines to establish baselines, then create custom pipelines for organization-specific quality dimensions. The validate-before-activate workflow catches configuration errors before pipelines go live.
### Pipeline Structure
| Component | Description |
| -------------------- | ----------------------------------------------------------------------------------------------------------------------------------------------------------------------------------------------------------------- |
| **Trigger** | Defines when the pipeline runs. Trigger types include Kafka events, scheduled intervals, in-platform events (for example, conversation completed), or filtered subsets of sessions. |
| **Processing nodes** | The evaluation and transformation logic applied to each triggered item. Nodes can read conversation data, query databases, aggregate metrics, filter records, transform data shapes, or call LLMs for evaluation. |
| **Metrics output** | The results the pipeline produces. Metrics take the form of named, typed values (counts, percentages, scores) that appear in the Data section and that you can wire into dashboards. |
### Pipeline Lifecycle
Pipelines follow a Draft → Validate → Test → Activate lifecycle. The editor toolbar shows the current state (Draft badge, "Validation passed" indicator) and provides buttons for Test, Validate, Save, and Activate. You can iterate on draft pipelines without disrupting live ones, save drafts as you go, validate to catch configuration errors before deployment, and run test executions to verify output before activating.
### Sub-Pipelines
You can reference one pipeline as a step inside another, enabling reuse and composability. For example, a "Compliance Evaluation" pipeline could call both the built-in "Guardrail Analysis" and a custom "Regulatory Wording Check" as sub-steps.
### Attaching to Dashboards
Once a custom pipeline produces data, its metrics appear alongside built-in metrics in **Agent Performance**, **Quality Monitor**, and **Customer Insights**, giving teams a single pane of glass across both standard and organization-specific evaluation.
Start with the built-in pipelines to establish baselines, then create custom pipelines for organization-specific quality dimensions. The validate-before-activate workflow catches configuration errors before pipelines go live.