> ## Documentation Index
> Fetch the complete documentation index at: https://koreai.mintlify.site/llms.txt
> Use this file to discover all available pages before exploring further.
# Analytics Explorer
The **Analytics Explorer** page monitors event volume, LLM performance, token consumption, and cost in near real time. Use it to investigate production incidents, track the impact of model changes, or audit LLM spend during peak traffic.
**Navigation**: **Project** -> **Insights** -> **Analytics Explorer**
**Date range**: Set at the upper-right area of the page, for example **Last 7 days**. Every tab follows this range.
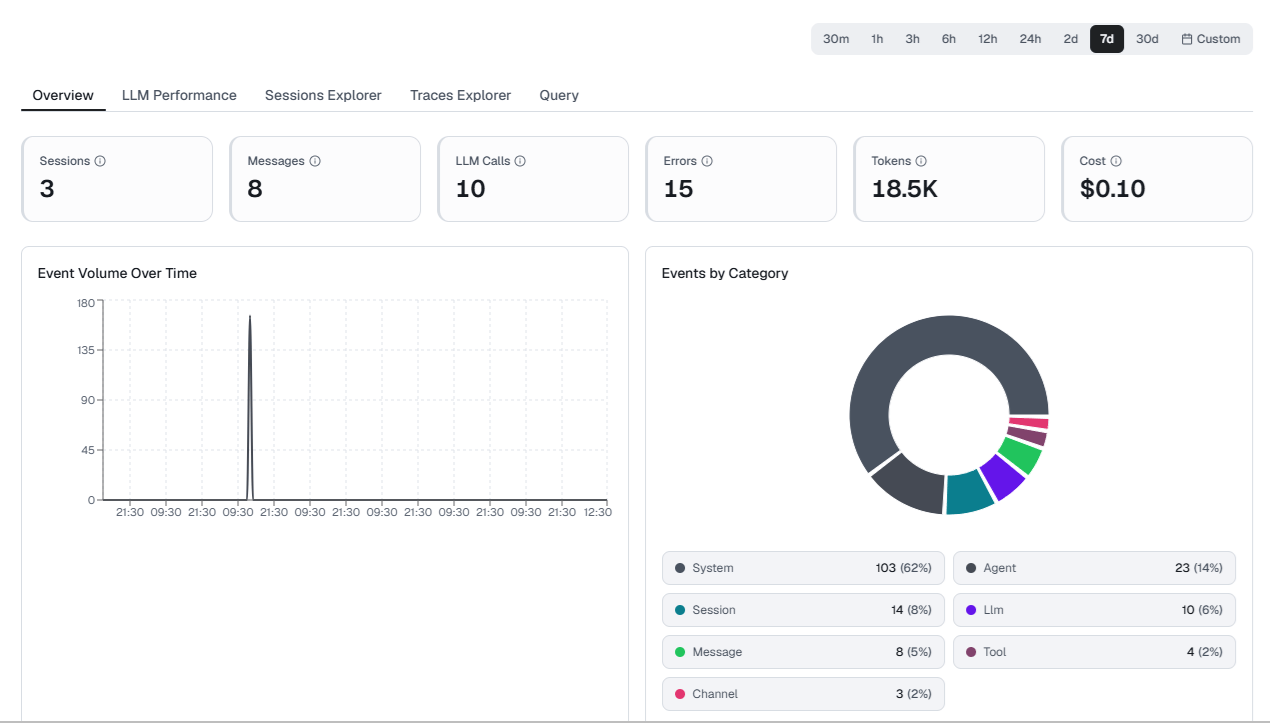 The page organizes its detail into five tabs.
| Tab | What it shows |
| --------------------- | ------------------------------------------------------------------------ |
| **Overview** | Headline volume, error, token, and cost metrics for the selected period. |
| **LLM Performance** | Model-level latency, token, error, and throughput metrics. |
| **Sessions Explorer** | Session-level records with filters, columns, and export. |
| **Traces Explorer** | Individual trace events, with timeline and waterfall views. |
| **Query** | Ad-hoc SQL against project event data. |
## Overview
Six metric cards summarize the selected period at a glance.
| Metric | Description |
| ------------- | -------------------------------------------------------------------------------------------------------------------------------------------------------- |
| **Sessions** | Total sessions in the selected period. A session is a single end-to-end interaction between a user and the agent system. |
| **Messages** | Total messages across all sessions, including both user messages and agent responses. |
| **LLM Calls** | Total LLM API calls agents made during the period. Includes calls to all configured models, for example routing, generation, and evaluation. |
| **Errors** | Total errors during agent execution, including LLM failures, timeout errors, and tool invocation errors. |
| **Tokens** | Total LLM tokens, both input and output, across all calls. |
| **Cost** | Estimated cost based on token usage and per-model pricing. Use it to track spend against budgets or compare cost-efficiency across model configurations. |
## LLM performance
Model-level metrics, including per-call latency distributions, average tokens per call, error rates by model, and throughput. Use this view to benchmark model performance and identify candidates for optimization or replacement.
The LLM Performance tab isn't captured in the current screenshots. Confirm its metric cards and charts before publishing.
## Sessions explorer
**Sessions Explorer** lists every session in the selected period so you can isolate the ones worth investigating. Four metric cards summarize the set.
| Metric | Description |
| ------------------ | -------------------------------------------------------- |
| **Total Sessions** | Sessions recorded in the selected period. |
| **Active** | Sessions currently in progress. |
| **Avg Duration** | Mean session duration across the set. |
| **Error Rate** | Percentage of sessions that recorded at least one error. |
### Narrow the list
Status chips filter the list to **All**, **Active**, **Completed**, **Escalated**, **Failed**, or **Ended**. Below the chips, five controls refine the results further.
| Control | Description |
| ------------------- | --------------------------------------------------------------------------------------- |
| **Search sessions** | Matches sessions by keyword. |
| **Channel** | Filters by the channel the session arrived on. Defaults to **All channels**. |
| **Environment** | Filters by deployment environment, for example `dev`. Defaults to **All environments**. |
| **Source** | Filters by session source. Defaults to **All sources**. |
| **Filters** | Opens additional filter options. |
Select **Columns** to choose which columns the table displays. Select **Export** to download the session list.
### Session list
| Column | Description |
| ----------------- | ------------------------------------------------------------------------------------- |
| **Session ID** | Unique session identifier, with a copy control. |
| **Agent** | Agent that handled the session, for example `MainSupervisor`. |
| **Status** | Current session state, for example `ended`. |
| **Environment** | Environment the session ran in. |
| **Last Activity** | Time since the last recorded activity. Sorts the table by default. |
| **Traces** | Number of trace events the session generated. |
| **Duration** | Total session duration. |
| **Tokens** | Total tokens the session consumed. |
| **Cost** | Estimated cost for the session. Values below the display threshold show as `<$0.001`. |
| **Errors** | Error count for the session. Non-zero values are highlighted. |
Expand a row to see the full session ID, channel, trace event count, and last activity. Select **View Traces** to open that session in **Traces Explorer**.
## Traces explorer
**Traces Explorer** inspects the individual events inside a session. Two sub-tabs divide the view: **Traces** for all execution events, and **Generations** for model generations.
### Filter traces
Type chips filter events to **All**, **LLM Call**, **Tool Call**, **Decision**, **Handoff**, **Error**, or **Agent**. Each applied filter appears as a chip below the search field, for example `Type: LLM Call`. Remove a single filter from its chip, or select **Clear all** to remove them all. **Reset filter** shows the number of active filters and restores the unfiltered list.
Use **Search traces** to match events by keyword, **Filters** for additional filter options, and **Export** to download the trace list.
### Sessions panel
The left panel lists the sessions in scope. Each card shows the agent name, status, span count, turn count, and duration. Select a session to load its events in the detail panel.
### Timeline and waterfall
The detail panel shows the selected session's events in one of two views. A counter reports how many events the current filter matches, for example `4 of 84 events`.
| View | Description |
| ------------- | ----------------------------------------------------------------------------------------------------------------------------------------------------------------------- |
| **Timeline** | Lists events in sequence as expandable cards. Use it to read an event's full payload. |
| **Waterfall** | Plots spans against a shared time axis, with each span's offset from the session start and its duration bar. Use it to find latency gaps and see where errors occurred. |
**Waterfall** opens with a summary bar reporting the trace mode (for example, **Historical**), **Spans**, **Duration**, **Tokens**, **Cost**, and **Errors**. Each span row shows a status icon for success or failure, the agent and model, the offset from session start, and the duration bar. Chips on the row repeat the span duration, token count, and cost.
### Event detail
Every event card carries the event type, agent name, and duration, plus `phase`, `run`, and `cause` badges. Expand a card for the full record.
| Field | Description |
| -------------- | ---------------------------------------------- |
| **Trace ID** | Identifier for the trace the event belongs to. |
| **Session ID** | Session the event belongs to. |
| **Span ID** | Identifier for this span. |
| **Event ID** | Identifier for this event. |
Each identifier has a copy control.
An **LLM Call** event adds model execution detail: **Model**, **Provider**, **Input Tokens**, **Output Tokens**, **Total Tokens**, **Cost**, and **Streaming**. Expand **Messages** to read the prompt and user turns, and **Response** to read the model output.
A **Tool Call** event shows the **Tool** name, an expandable **Input**, and **Show raw data** for the unformatted payload.
## Query
The **Query** tab runs SQL against project event data for investigations the pre-built views don't cover.
1. Select a table, for example `abl_platform.platform_events`.
2. Write your SQL, or select **Example Queries** to start from a template.
3. Select **Execute**. Select **Clear** to empty the editor.
Queries use the same scoping tokens as dashboard widgets. Use `{tenantId:String}` and `{projectId:String}` for tenant and project isolation, and `{from:DateTime64(3)}` and `{to:DateTime64(3)}` to follow the selected time range. `{sessionId:String}` is optional. Results are capped at 1,000 rows.
The following query counts events by type and flags errors:
```sql theme={null}
SELECT
event_type,
count() AS cnt,
countIf(has_error = 1) AS errors
FROM abl_platform.platform_events
WHERE tenant_id = {tenantId:String}
AND project_id = {projectId:String}
AND timestamp >= {from:DateTime64(3)}
AND timestamp <= {to:DateTime64(3)}
GROUP BY event_type
ORDER BY cnt DESC
LIMIT 100
```
The results panel reports the row count and runtime, for example `Results — 20 rows (11ms)`. Select **Copy** to copy the result set, or **Add to dashboard** to save the query as a widget on a custom dashboard.
The page organizes its detail into five tabs.
| Tab | What it shows |
| --------------------- | ------------------------------------------------------------------------ |
| **Overview** | Headline volume, error, token, and cost metrics for the selected period. |
| **LLM Performance** | Model-level latency, token, error, and throughput metrics. |
| **Sessions Explorer** | Session-level records with filters, columns, and export. |
| **Traces Explorer** | Individual trace events, with timeline and waterfall views. |
| **Query** | Ad-hoc SQL against project event data. |
## Overview
Six metric cards summarize the selected period at a glance.
| Metric | Description |
| ------------- | -------------------------------------------------------------------------------------------------------------------------------------------------------- |
| **Sessions** | Total sessions in the selected period. A session is a single end-to-end interaction between a user and the agent system. |
| **Messages** | Total messages across all sessions, including both user messages and agent responses. |
| **LLM Calls** | Total LLM API calls agents made during the period. Includes calls to all configured models, for example routing, generation, and evaluation. |
| **Errors** | Total errors during agent execution, including LLM failures, timeout errors, and tool invocation errors. |
| **Tokens** | Total LLM tokens, both input and output, across all calls. |
| **Cost** | Estimated cost based on token usage and per-model pricing. Use it to track spend against budgets or compare cost-efficiency across model configurations. |
## LLM performance
Model-level metrics, including per-call latency distributions, average tokens per call, error rates by model, and throughput. Use this view to benchmark model performance and identify candidates for optimization or replacement.
The LLM Performance tab isn't captured in the current screenshots. Confirm its metric cards and charts before publishing.
## Sessions explorer
**Sessions Explorer** lists every session in the selected period so you can isolate the ones worth investigating. Four metric cards summarize the set.
| Metric | Description |
| ------------------ | -------------------------------------------------------- |
| **Total Sessions** | Sessions recorded in the selected period. |
| **Active** | Sessions currently in progress. |
| **Avg Duration** | Mean session duration across the set. |
| **Error Rate** | Percentage of sessions that recorded at least one error. |
### Narrow the list
Status chips filter the list to **All**, **Active**, **Completed**, **Escalated**, **Failed**, or **Ended**. Below the chips, five controls refine the results further.
| Control | Description |
| ------------------- | --------------------------------------------------------------------------------------- |
| **Search sessions** | Matches sessions by keyword. |
| **Channel** | Filters by the channel the session arrived on. Defaults to **All channels**. |
| **Environment** | Filters by deployment environment, for example `dev`. Defaults to **All environments**. |
| **Source** | Filters by session source. Defaults to **All sources**. |
| **Filters** | Opens additional filter options. |
Select **Columns** to choose which columns the table displays. Select **Export** to download the session list.
### Session list
| Column | Description |
| ----------------- | ------------------------------------------------------------------------------------- |
| **Session ID** | Unique session identifier, with a copy control. |
| **Agent** | Agent that handled the session, for example `MainSupervisor`. |
| **Status** | Current session state, for example `ended`. |
| **Environment** | Environment the session ran in. |
| **Last Activity** | Time since the last recorded activity. Sorts the table by default. |
| **Traces** | Number of trace events the session generated. |
| **Duration** | Total session duration. |
| **Tokens** | Total tokens the session consumed. |
| **Cost** | Estimated cost for the session. Values below the display threshold show as `<$0.001`. |
| **Errors** | Error count for the session. Non-zero values are highlighted. |
Expand a row to see the full session ID, channel, trace event count, and last activity. Select **View Traces** to open that session in **Traces Explorer**.
## Traces explorer
**Traces Explorer** inspects the individual events inside a session. Two sub-tabs divide the view: **Traces** for all execution events, and **Generations** for model generations.
### Filter traces
Type chips filter events to **All**, **LLM Call**, **Tool Call**, **Decision**, **Handoff**, **Error**, or **Agent**. Each applied filter appears as a chip below the search field, for example `Type: LLM Call`. Remove a single filter from its chip, or select **Clear all** to remove them all. **Reset filter** shows the number of active filters and restores the unfiltered list.
Use **Search traces** to match events by keyword, **Filters** for additional filter options, and **Export** to download the trace list.
### Sessions panel
The left panel lists the sessions in scope. Each card shows the agent name, status, span count, turn count, and duration. Select a session to load its events in the detail panel.
### Timeline and waterfall
The detail panel shows the selected session's events in one of two views. A counter reports how many events the current filter matches, for example `4 of 84 events`.
| View | Description |
| ------------- | ----------------------------------------------------------------------------------------------------------------------------------------------------------------------- |
| **Timeline** | Lists events in sequence as expandable cards. Use it to read an event's full payload. |
| **Waterfall** | Plots spans against a shared time axis, with each span's offset from the session start and its duration bar. Use it to find latency gaps and see where errors occurred. |
**Waterfall** opens with a summary bar reporting the trace mode (for example, **Historical**), **Spans**, **Duration**, **Tokens**, **Cost**, and **Errors**. Each span row shows a status icon for success or failure, the agent and model, the offset from session start, and the duration bar. Chips on the row repeat the span duration, token count, and cost.
### Event detail
Every event card carries the event type, agent name, and duration, plus `phase`, `run`, and `cause` badges. Expand a card for the full record.
| Field | Description |
| -------------- | ---------------------------------------------- |
| **Trace ID** | Identifier for the trace the event belongs to. |
| **Session ID** | Session the event belongs to. |
| **Span ID** | Identifier for this span. |
| **Event ID** | Identifier for this event. |
Each identifier has a copy control.
An **LLM Call** event adds model execution detail: **Model**, **Provider**, **Input Tokens**, **Output Tokens**, **Total Tokens**, **Cost**, and **Streaming**. Expand **Messages** to read the prompt and user turns, and **Response** to read the model output.
A **Tool Call** event shows the **Tool** name, an expandable **Input**, and **Show raw data** for the unformatted payload.
## Query
The **Query** tab runs SQL against project event data for investigations the pre-built views don't cover.
1. Select a table, for example `abl_platform.platform_events`.
2. Write your SQL, or select **Example Queries** to start from a template.
3. Select **Execute**. Select **Clear** to empty the editor.
Queries use the same scoping tokens as dashboard widgets. Use `{tenantId:String}` and `{projectId:String}` for tenant and project isolation, and `{from:DateTime64(3)}` and `{to:DateTime64(3)}` to follow the selected time range. `{sessionId:String}` is optional. Results are capped at 1,000 rows.
The following query counts events by type and flags errors:
```sql theme={null}
SELECT
event_type,
count() AS cnt,
countIf(has_error = 1) AS errors
FROM abl_platform.platform_events
WHERE tenant_id = {tenantId:String}
AND project_id = {projectId:String}
AND timestamp >= {from:DateTime64(3)}
AND timestamp <= {to:DateTime64(3)}
GROUP BY event_type
ORDER BY cnt DESC
LIMIT 100
```
The results panel reports the row count and runtime, for example `Results — 20 rows (11ms)`. Select **Copy** to copy the result set, or **Add to dashboard** to save the query as a widget on a custom dashboard.